ShunChecker rev2.0 Documentation
This document is for ShunChecker rev.2.
| rev.1 | rev.2 | |
|---|---|---|
| USB | Type-B mini | Type-C |
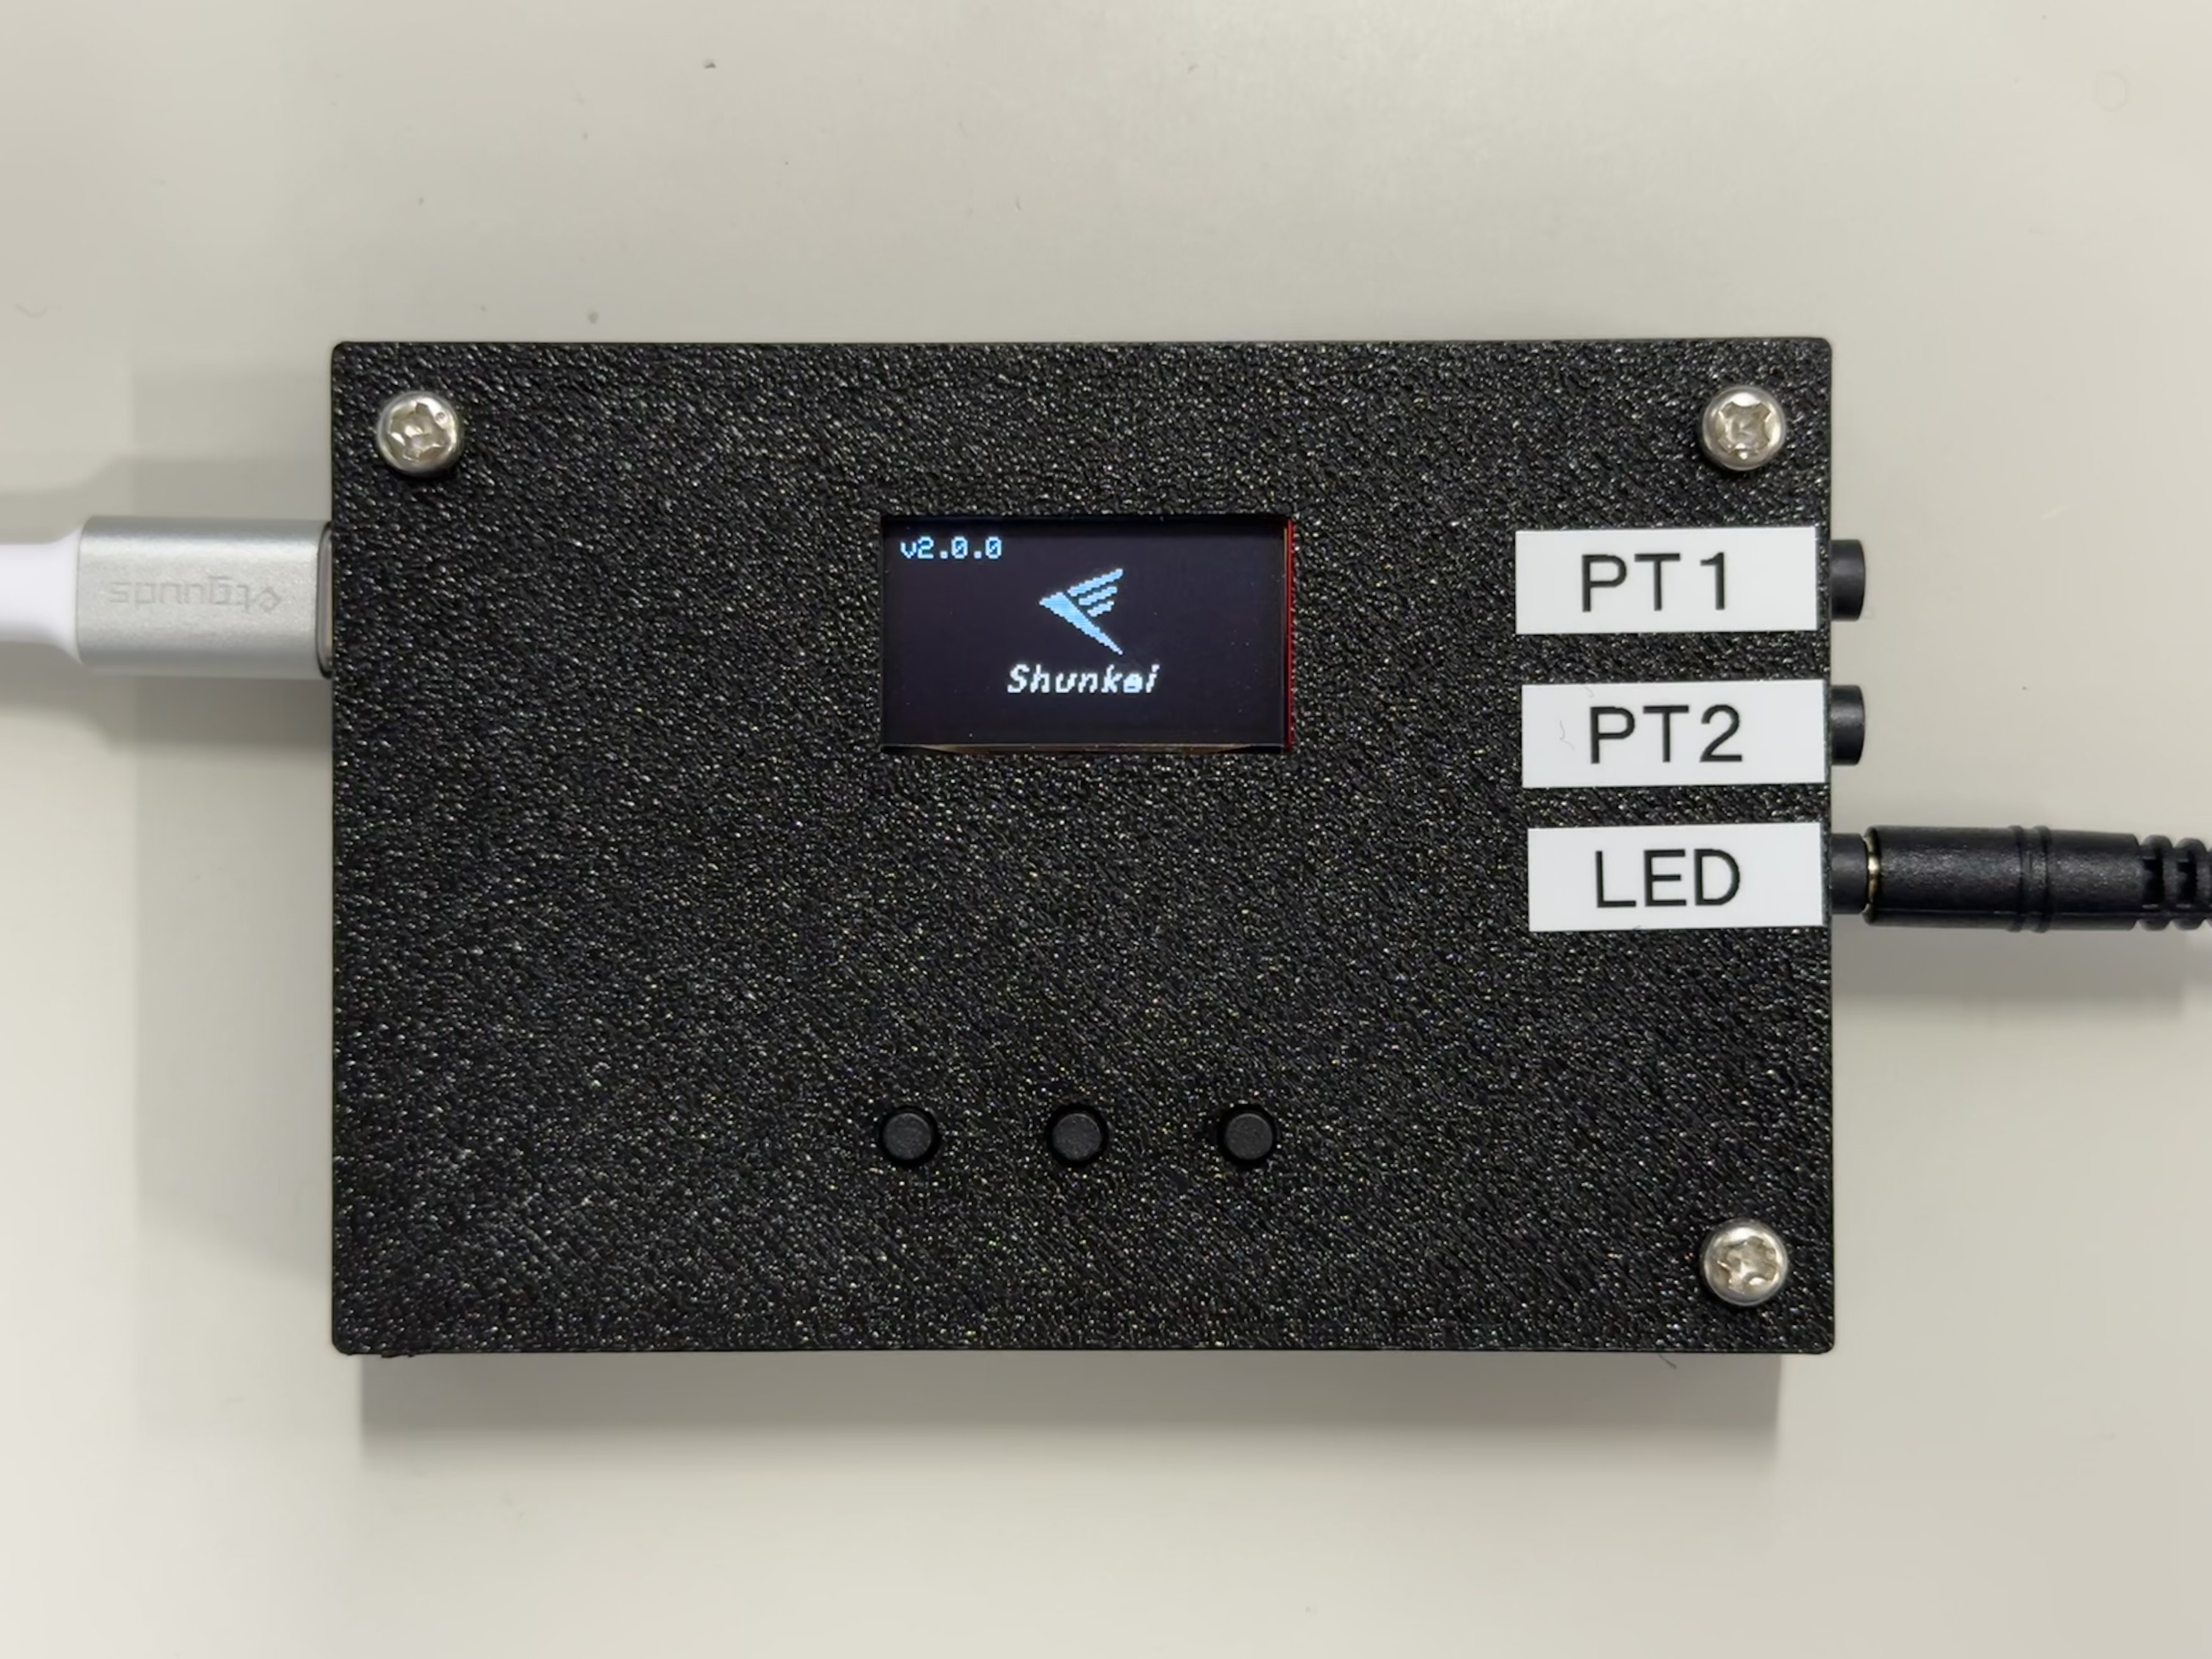
| Boot screen | Displays "ShunChecker" text | Displays Shunkei logo and version |
| Main buttons | None | Available (3 buttons) |
The basic usage is mostly the same as rev.1, but waveform viewing and gain adjustment are available only on rev.2.
Features
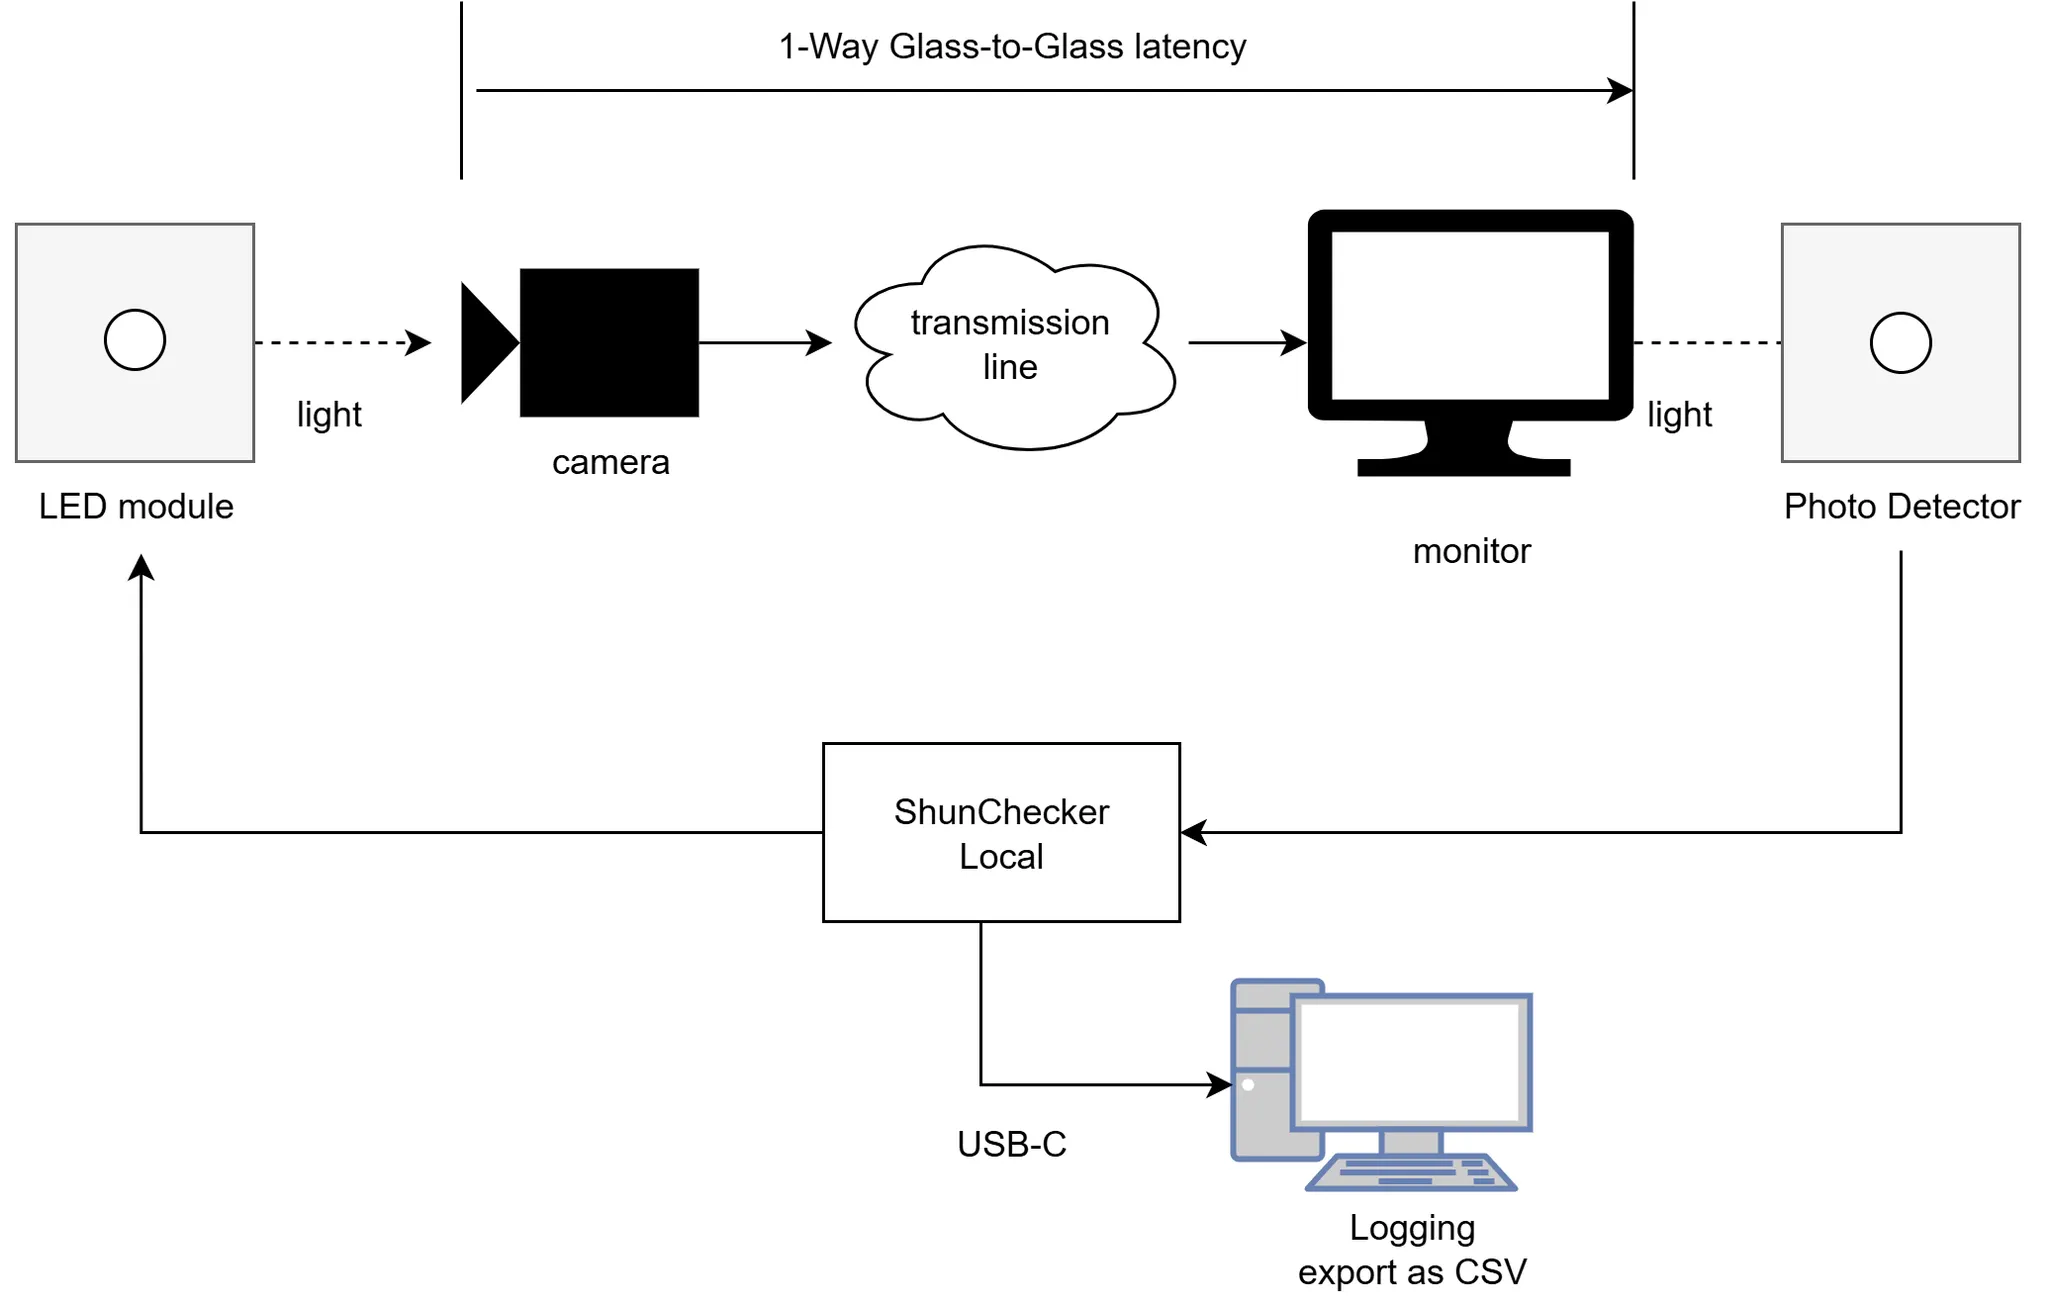
- Glass-to-Glass latency can be measured with 2 μs resolution (from light input to camera until display output lights up). Both rising and falling transitions are measurable.
- Powered by USB-C. Supports convenient standalone operation for field use and PC connection for detailed analysis.
- Measured waveforms can be viewed on the built-in LCD and in a browser. Measurement results can be saved in CSV format.
- The ShunChecker local version can measure Glass-to-Glass latency of a nearby camera/display setup using a single checker unit.
- The ShunChecker remote measurement version supports 1-way remote latency measurement (one-way, no loopback). It uses high-precision internal timekeeping by OCXO and PPS signals from an optional GPS module. It also provides consistent measurements by accounting for natural drift between camera and display synchronization timing.
Hardware Components
Measurement is performed by connecting the sensor module and LED module to ShunChecker. USB-C provides both power and PC communication.
How To Use
1. Connect the modules
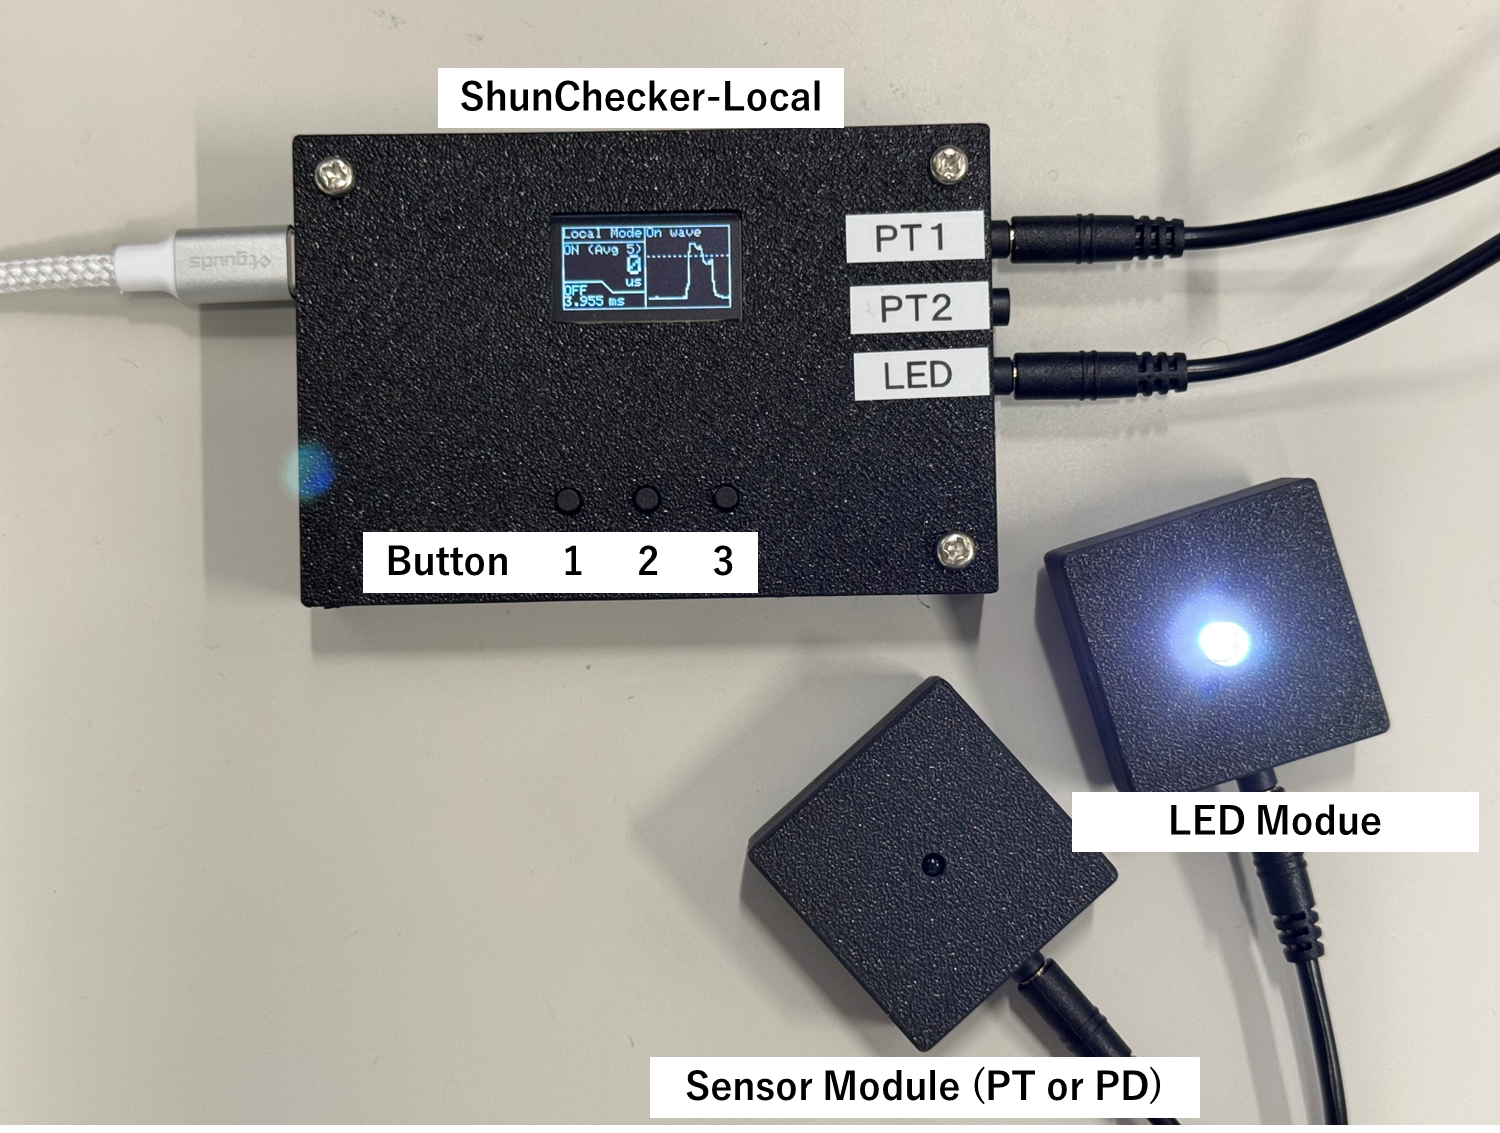
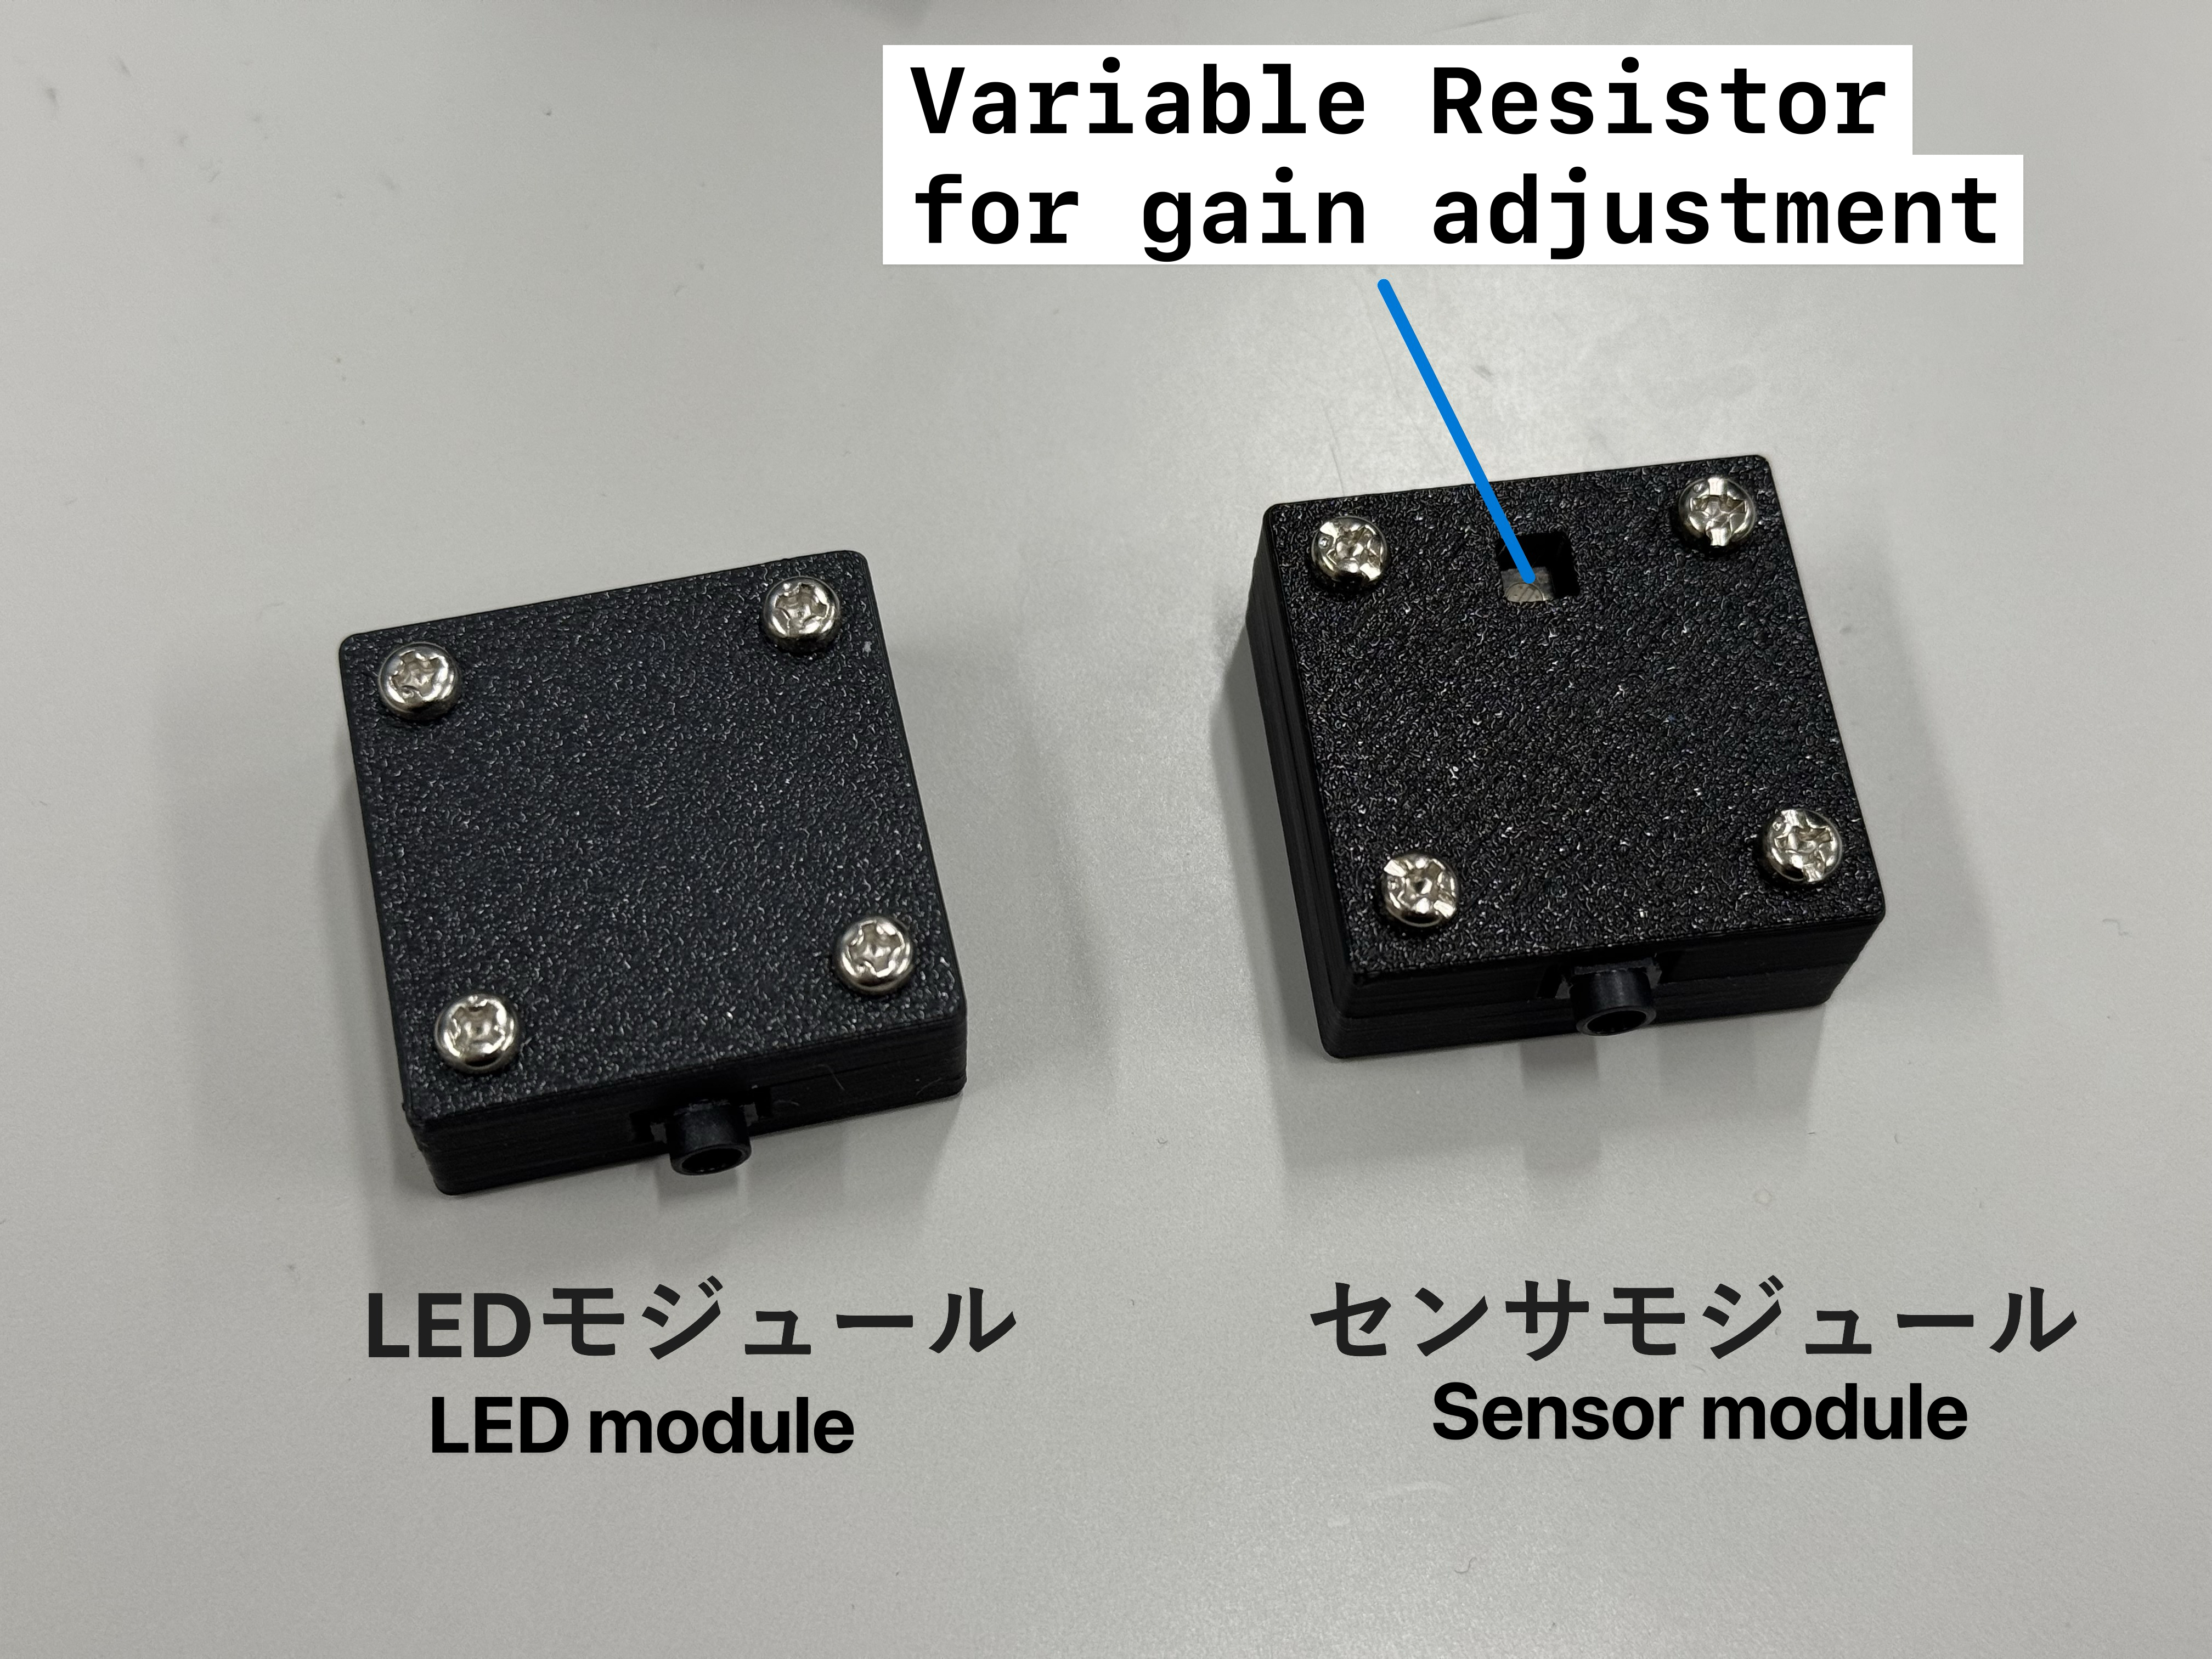
Connect the LED module to the LED port and the sensor module to the PT1 port using the included 3.5 mm plug cable. PT2 is unused in this version. The sensor module has a rear hole for gain adjustment, and its front opening is smaller than the LED module.
🔥 There have been cases where the sensor circuit was damaged due to connecting LED and PT ports incorrectly. Please double-check the connections.
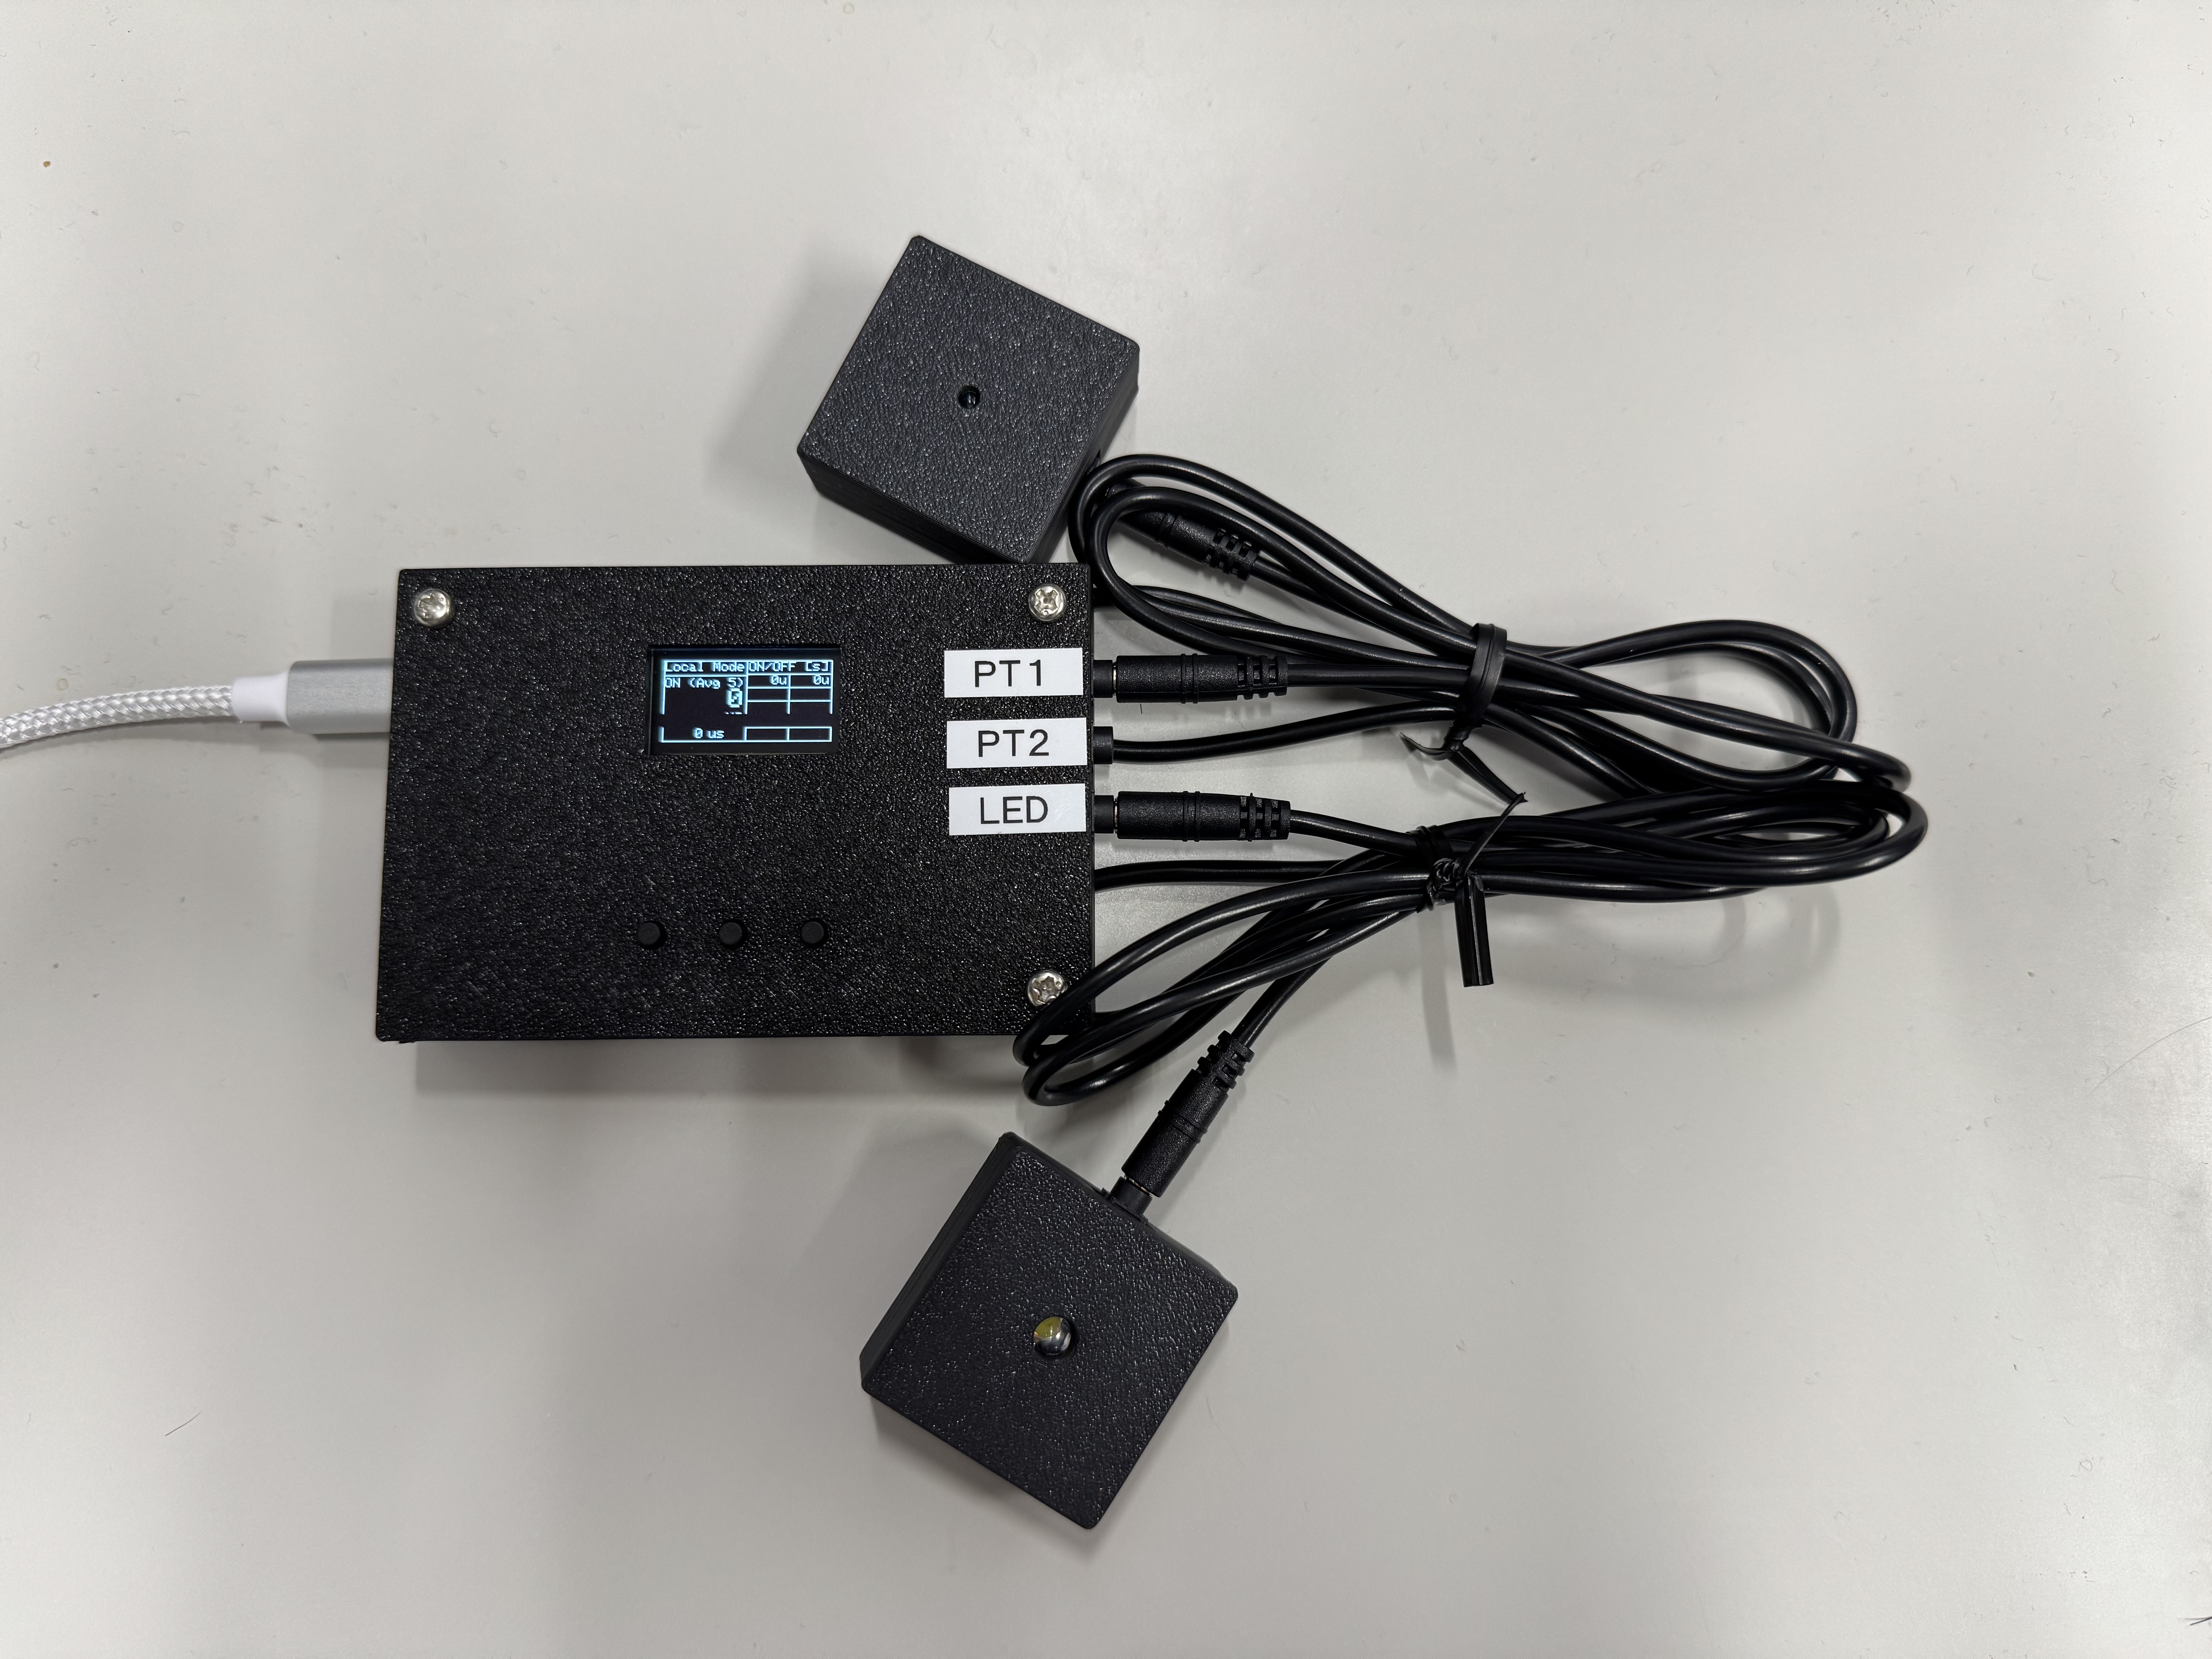
Connected modules
Rear View
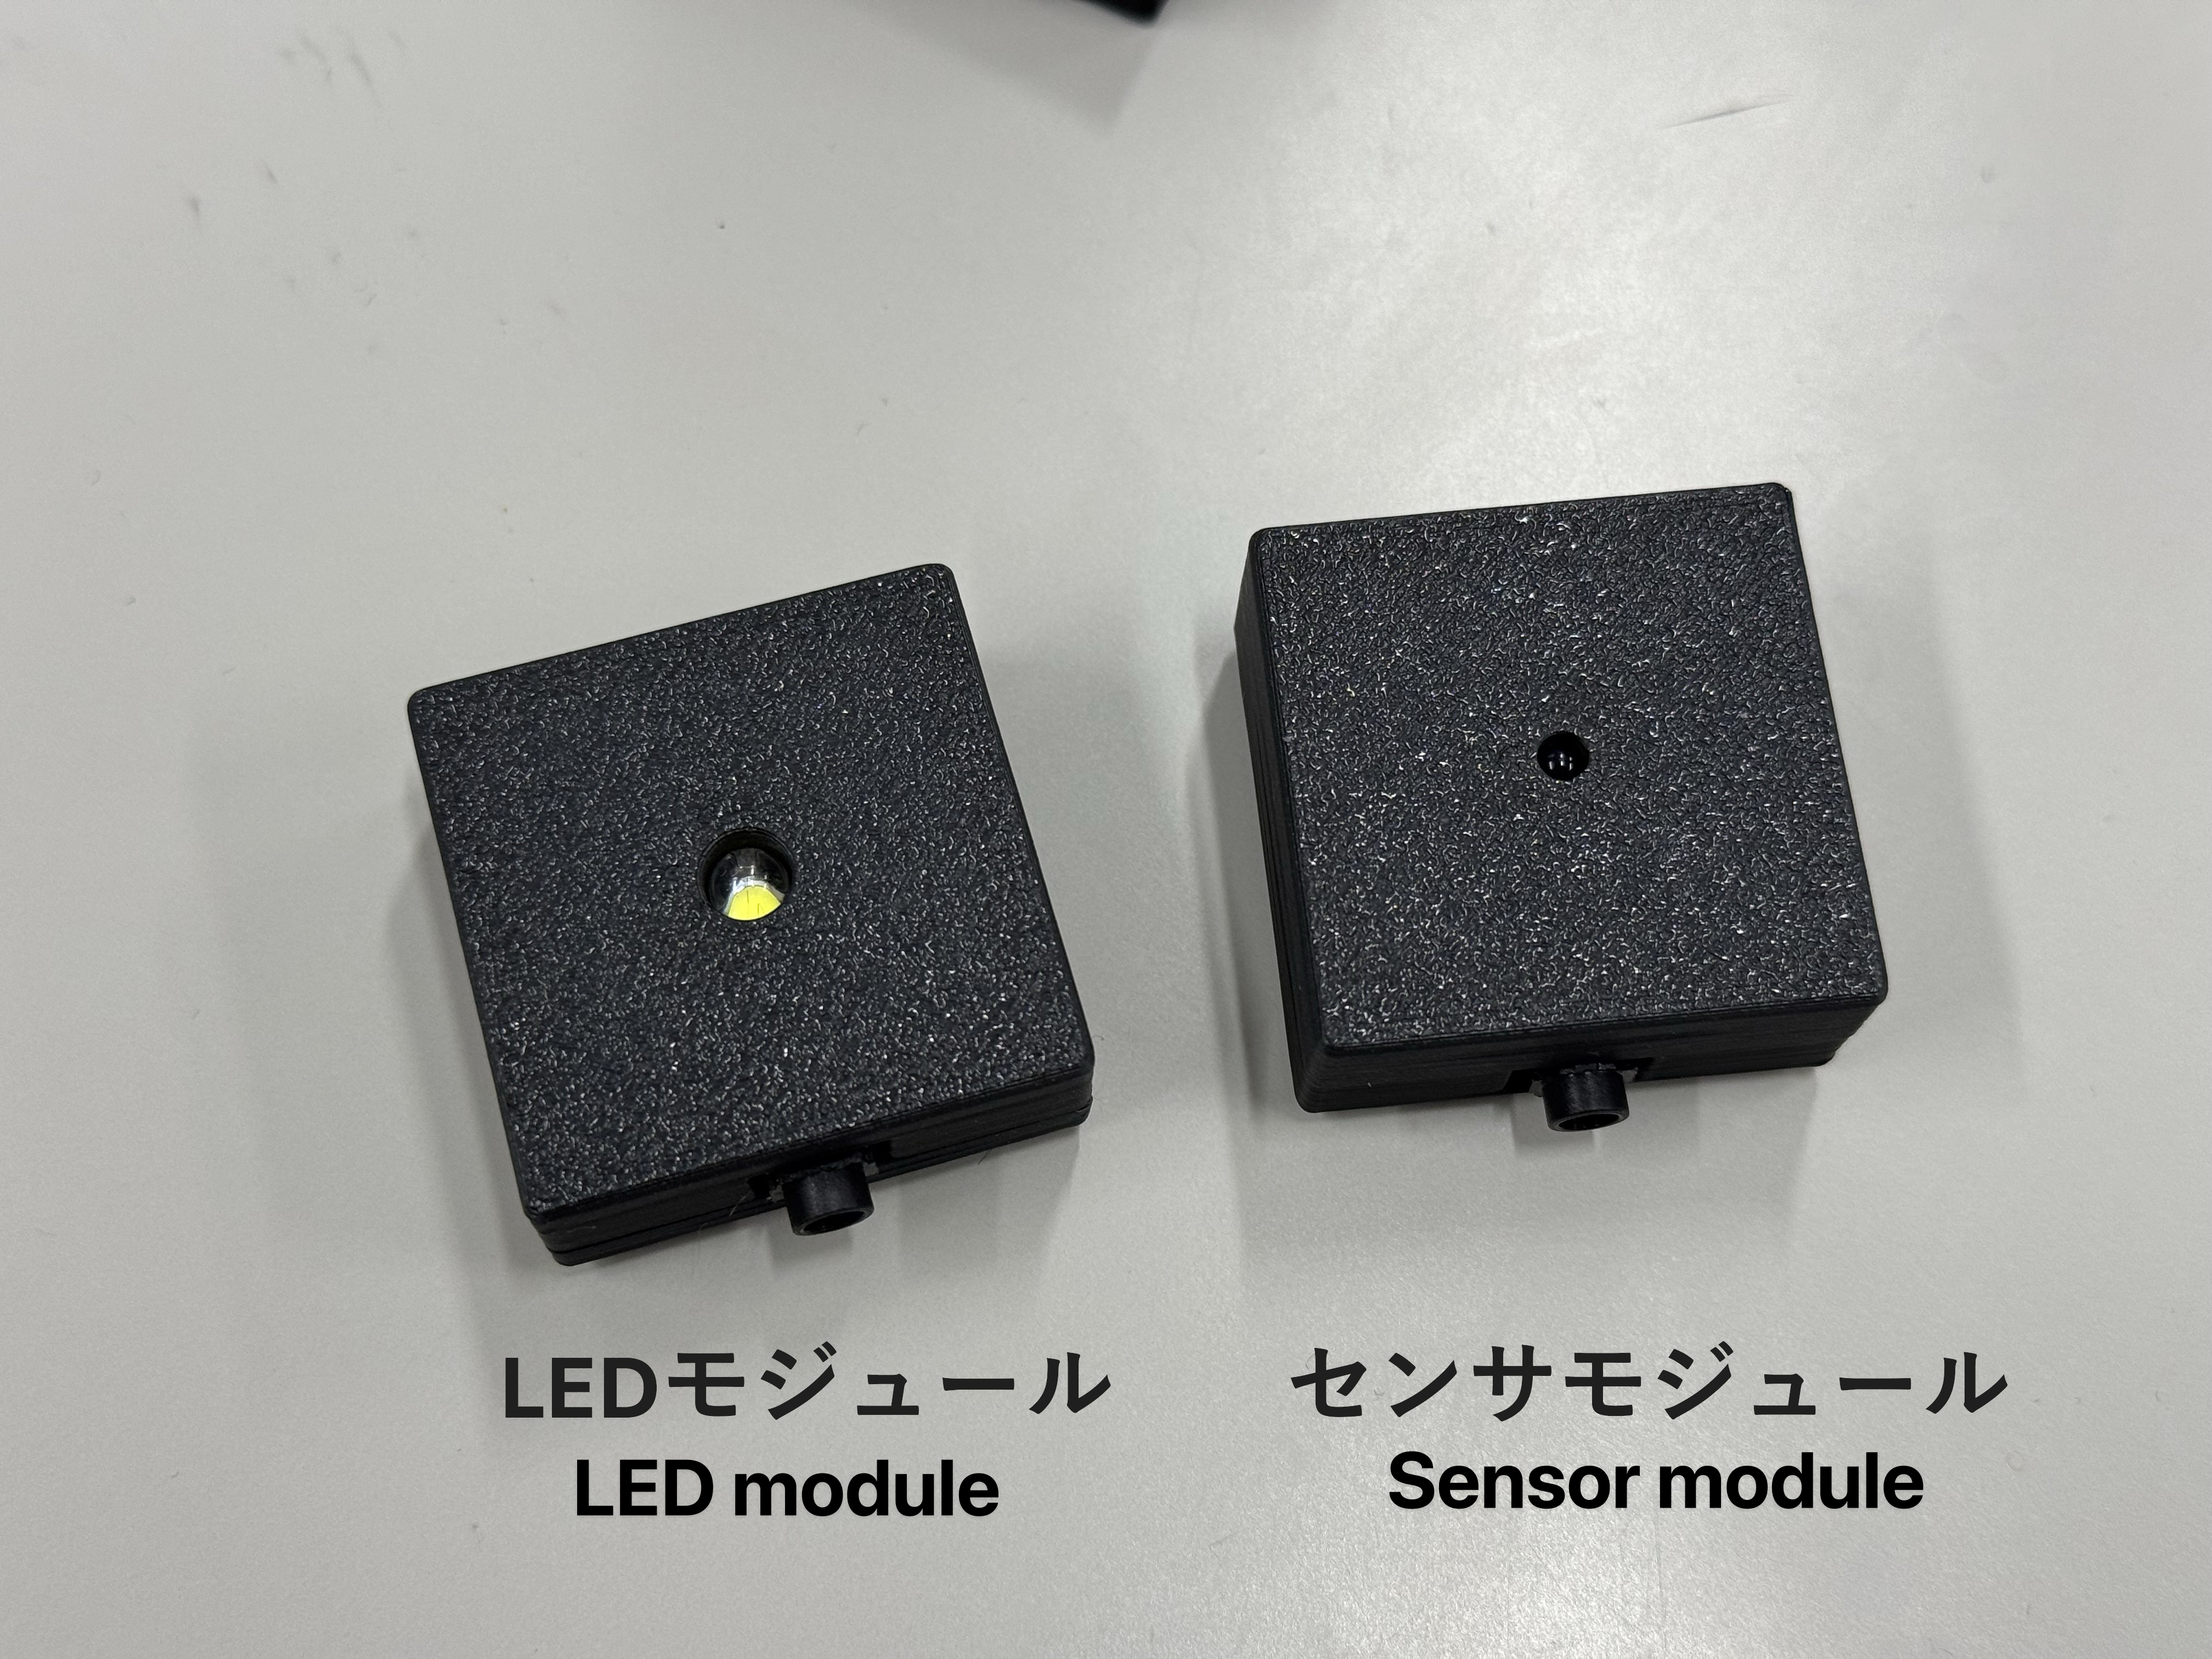
Front View
After powering on, the screen is displayed. If the sensor and LED are facing each other properly, measurement starts and results appear on the LCD. If no change is observed, nothing may be connected, or the wrong port may be used.
Example where measurement does not start because the sensor is not connected
2. Connect to a PC
Connect a USB-C cable to your PC and open the ShunChecker website.
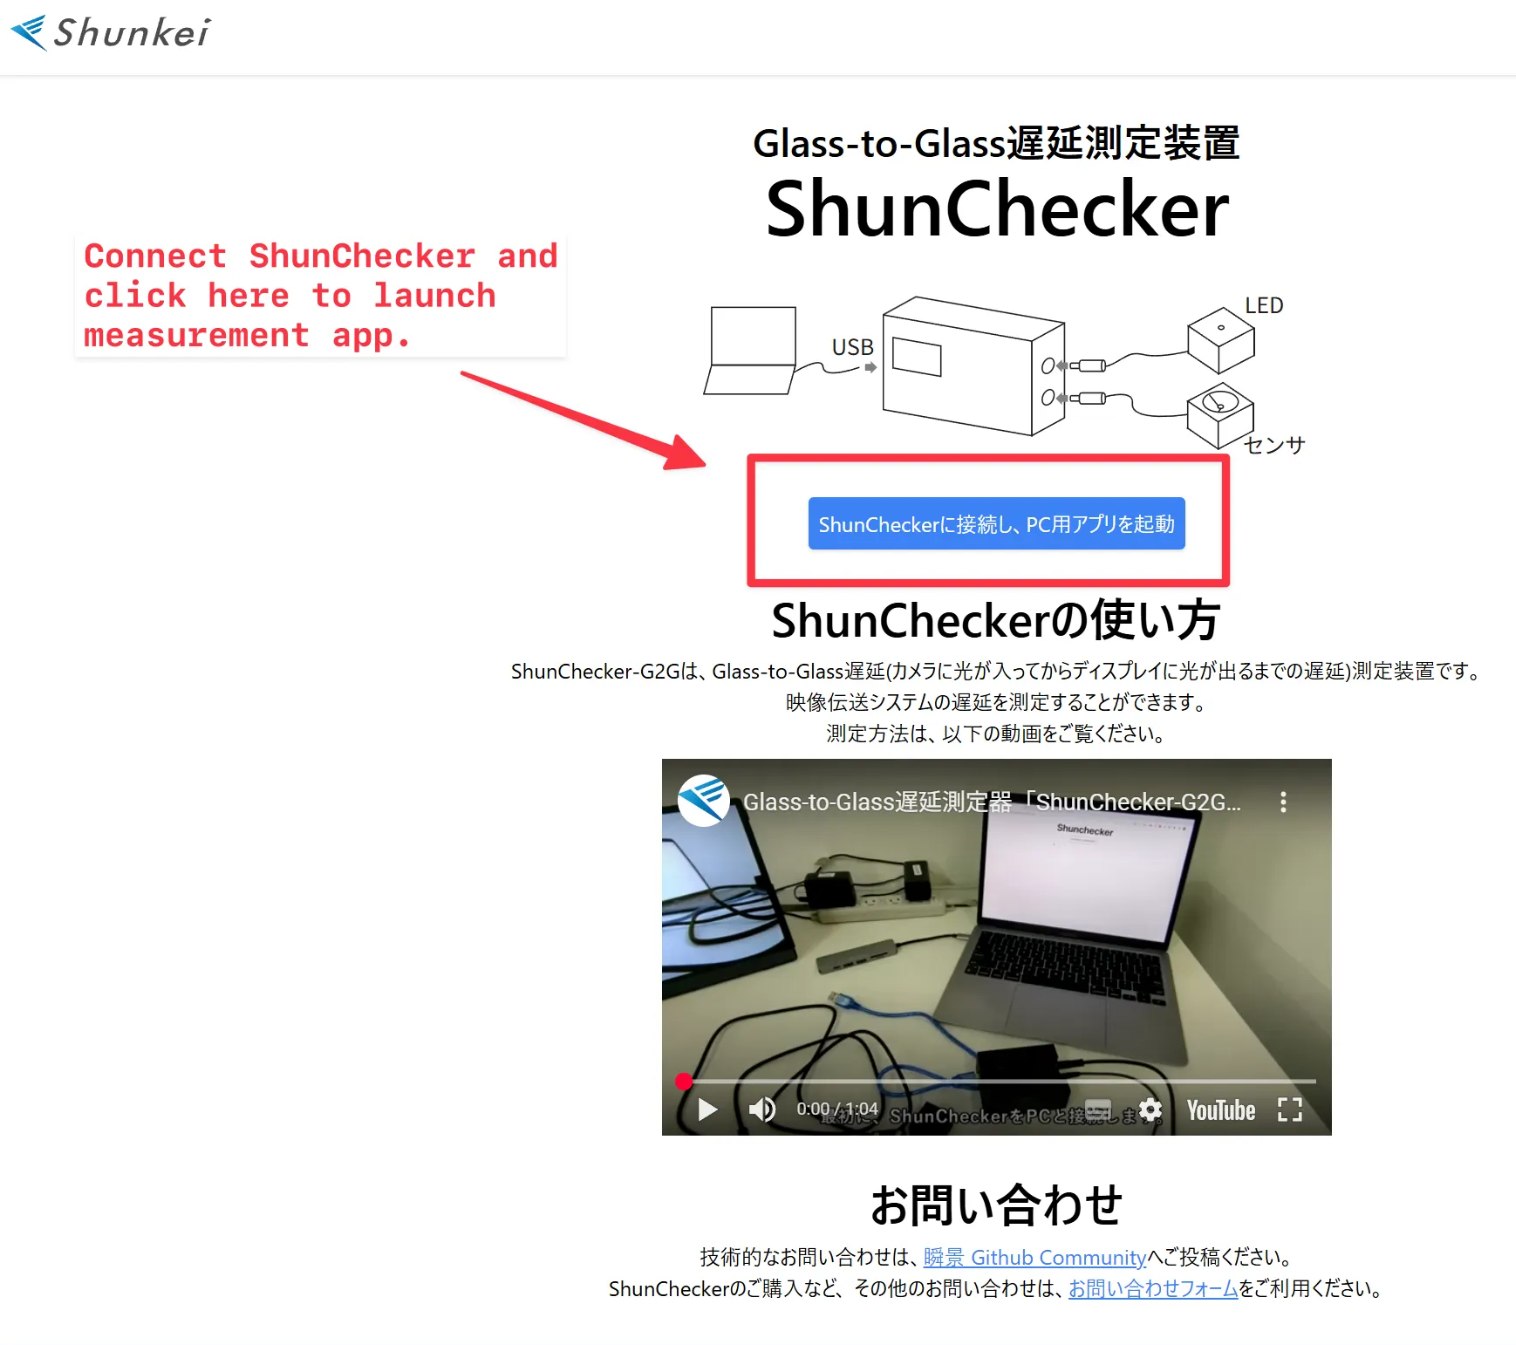
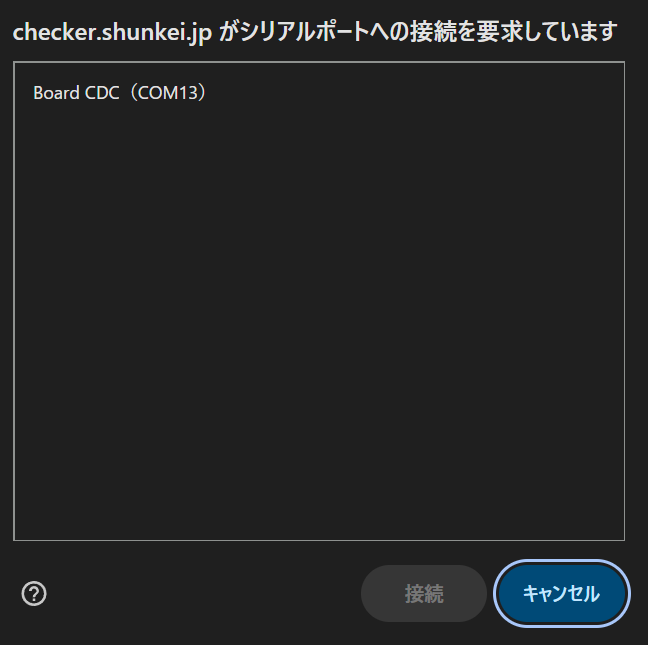
Press the start button in the PC application and select the serial port.
Take measurements
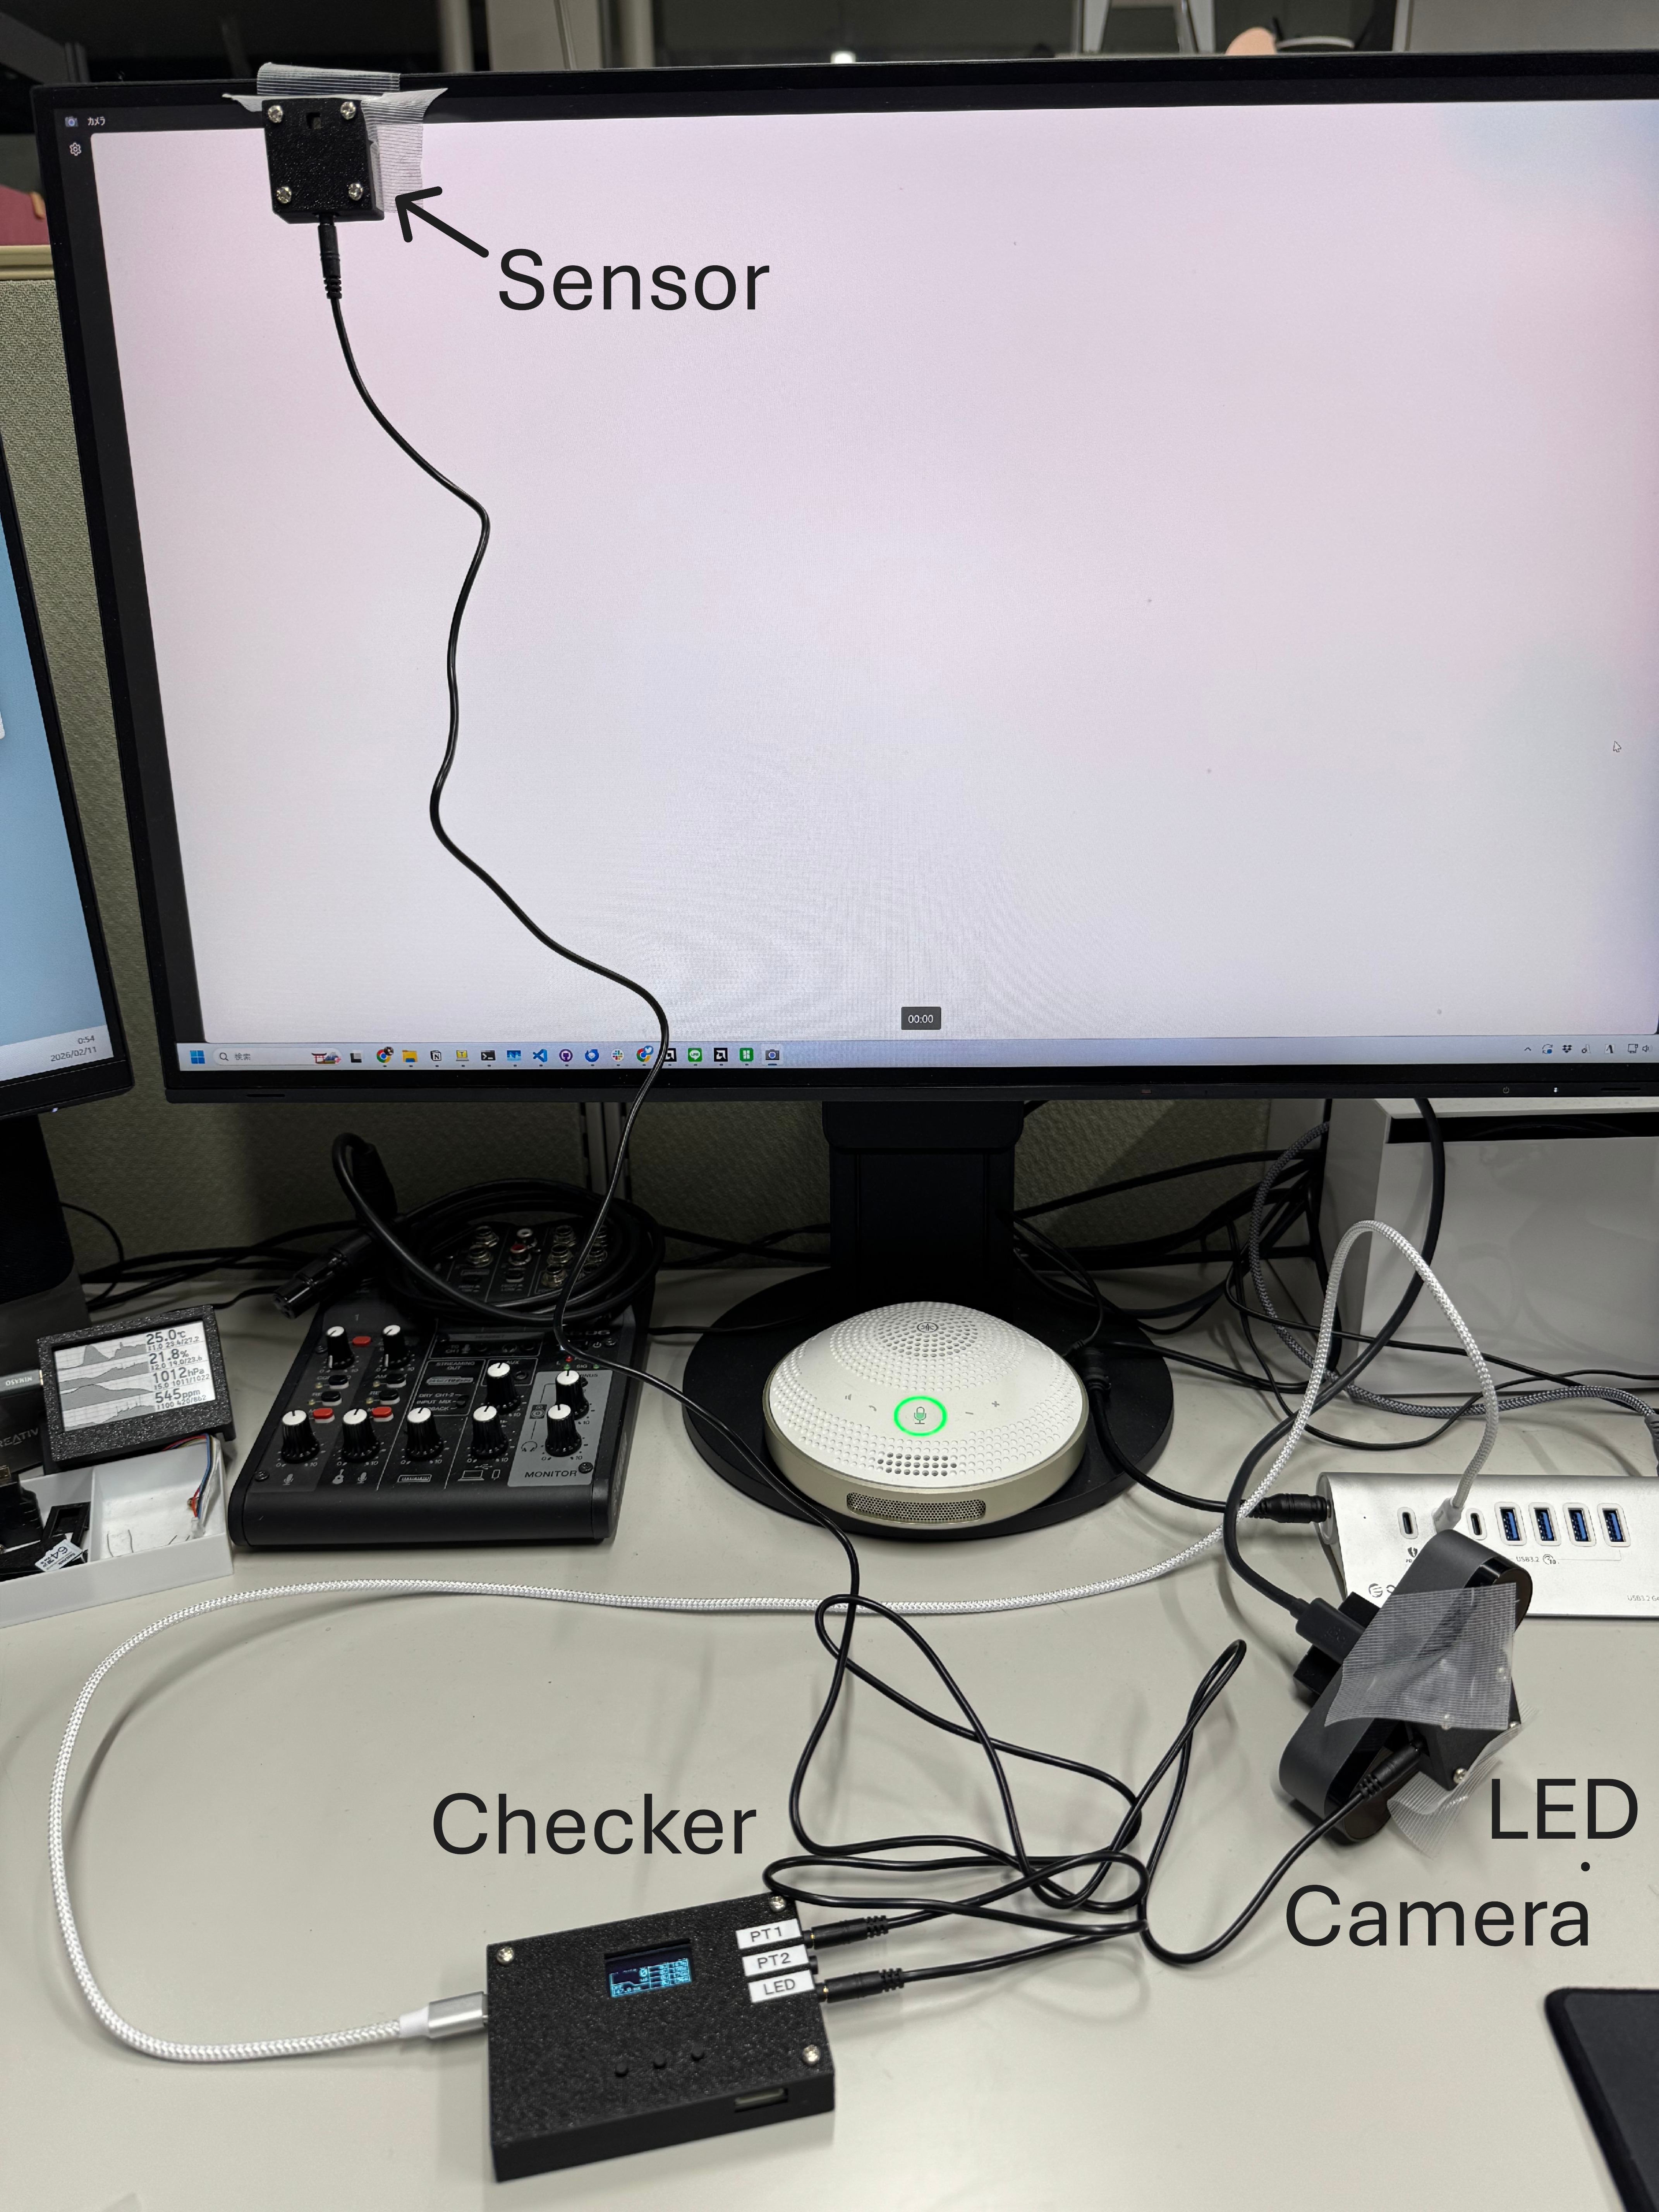
For easier measurement, fix the camera/LED side with tape and place the sensor side by hand.
Place the LED on the camera side and the sensor on the display side. Keep the sensor as close to the display panel as possible. For some displays, panel response delay is more visible, so measuring near the upper-left area of the screen is recommended.
About Checker screens
Checker has three screens. Even without PC connection, you can quickly check latency on the LCD. This is also useful for calibration.
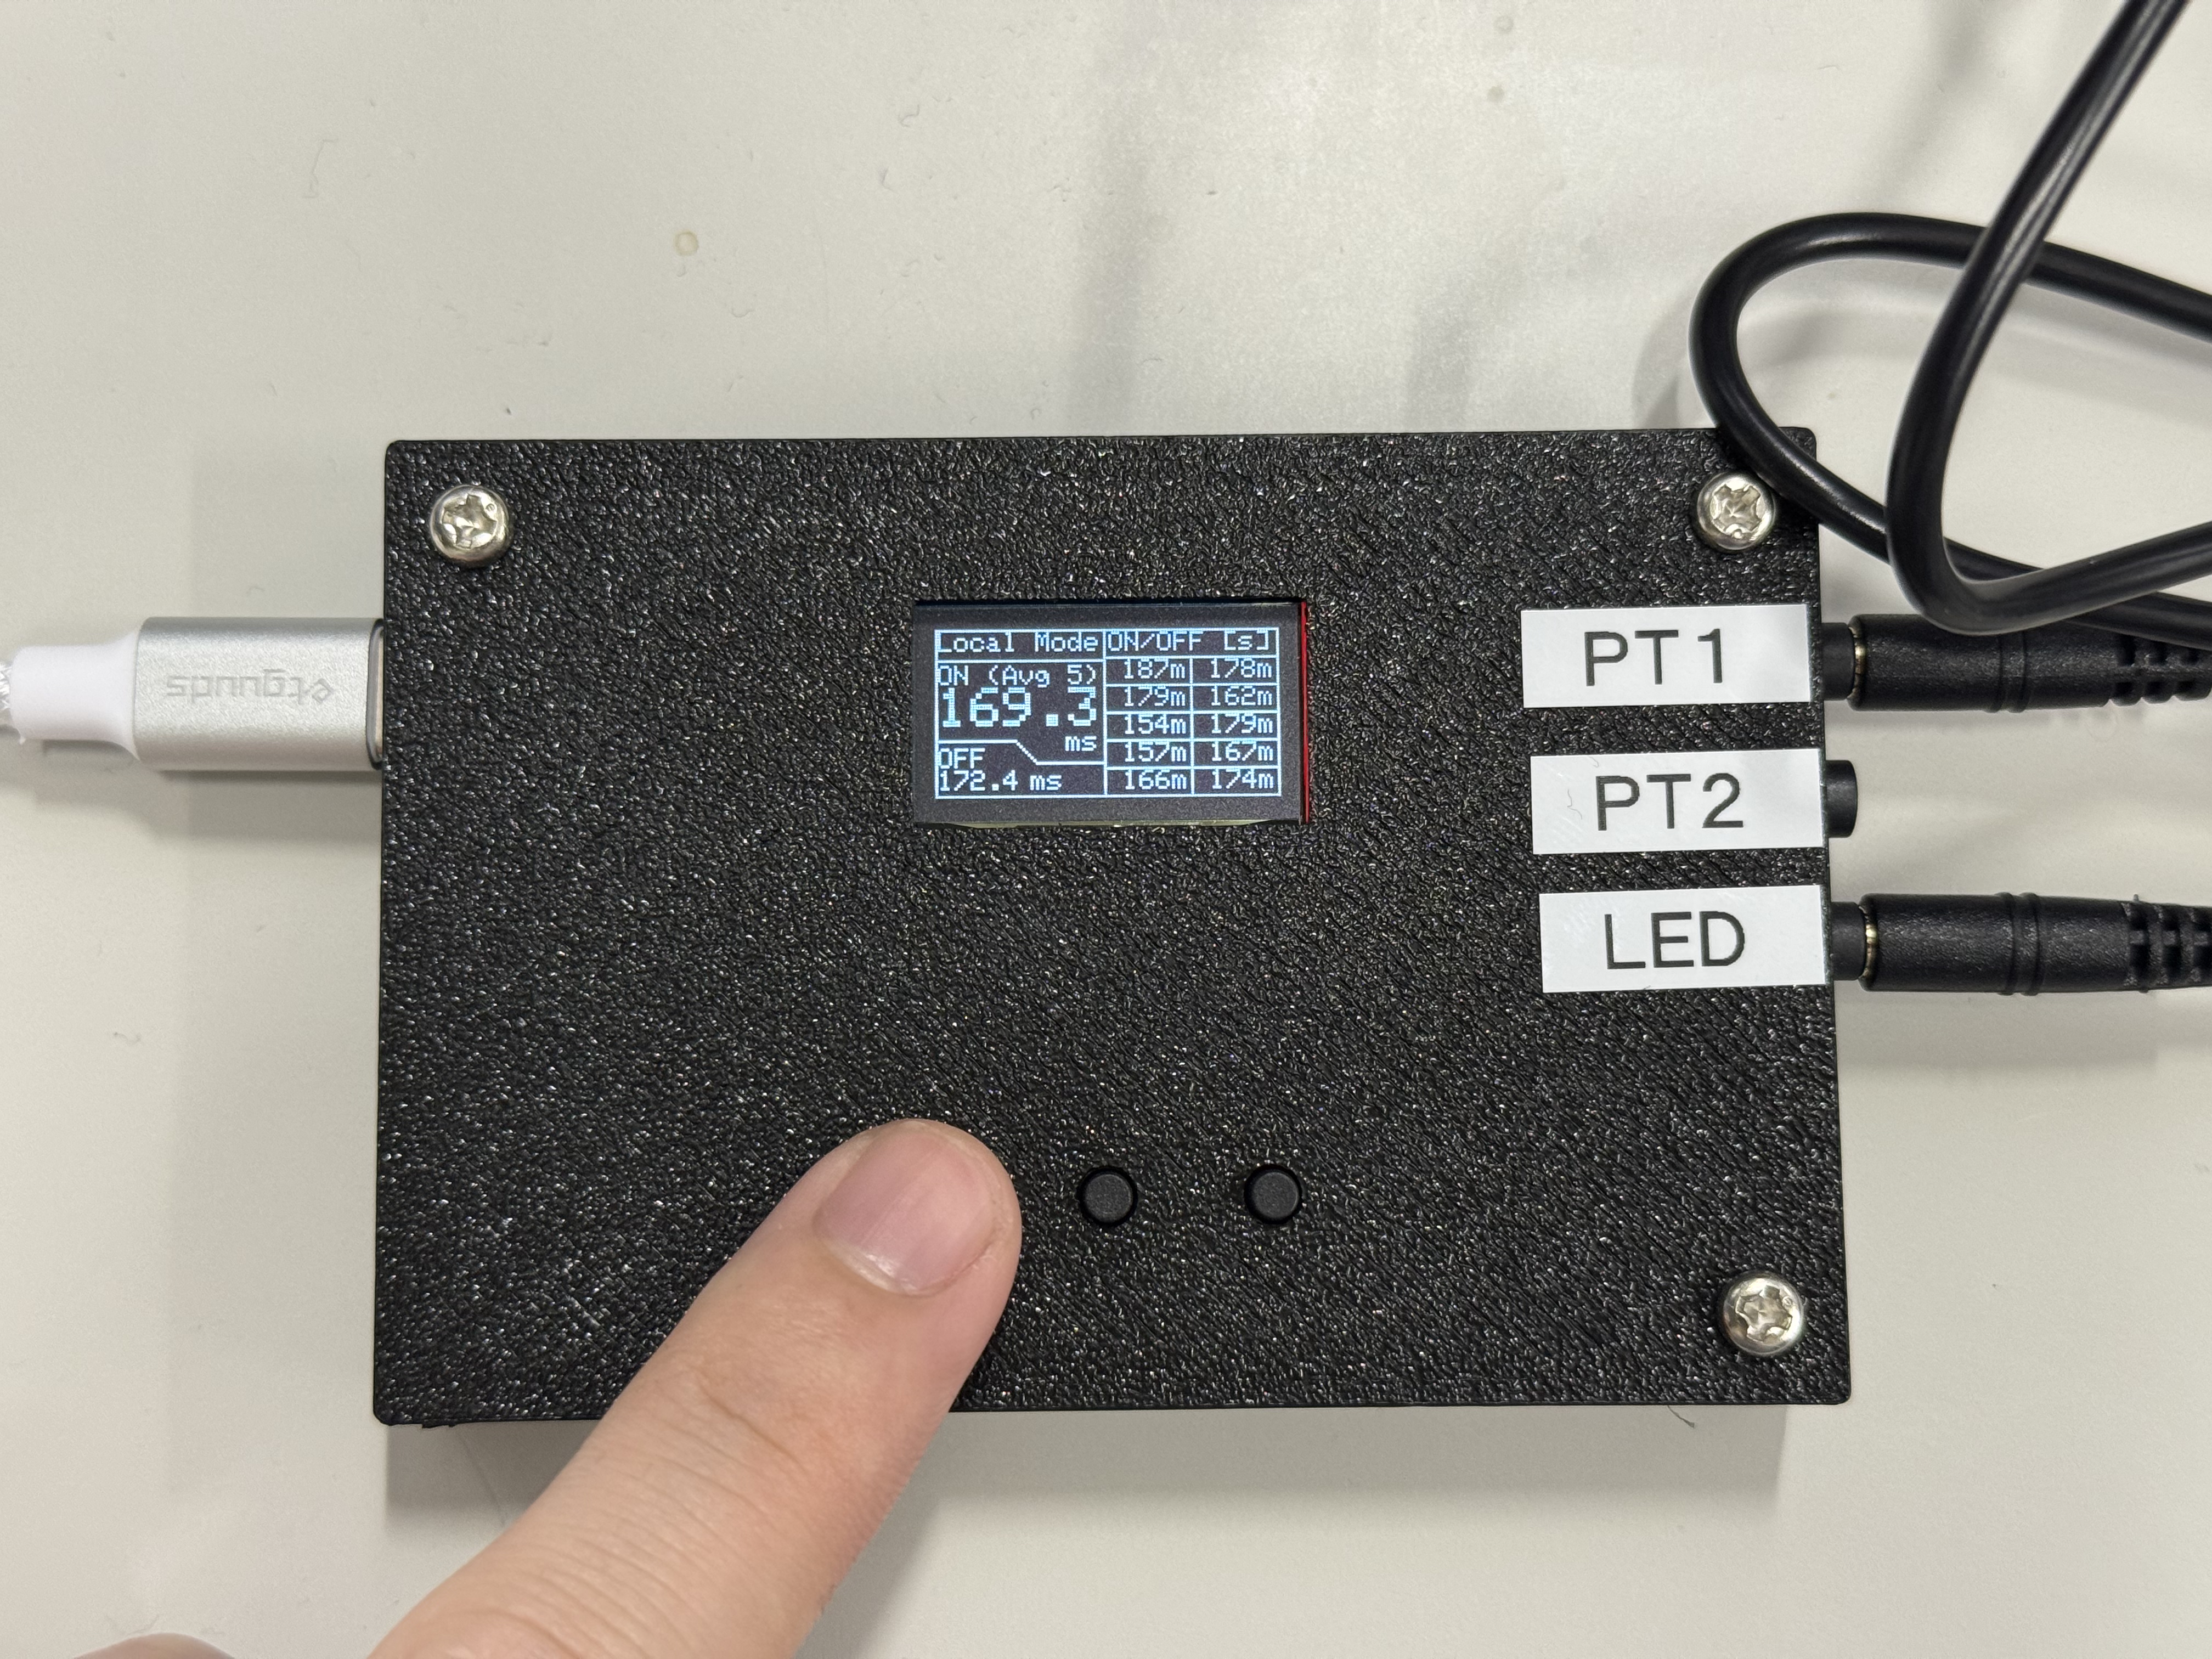
Screen 1: The right side shows the last 5 measurements. The left side shows the moving average of the last 5 measurements. Press the left button to move to the next screen.
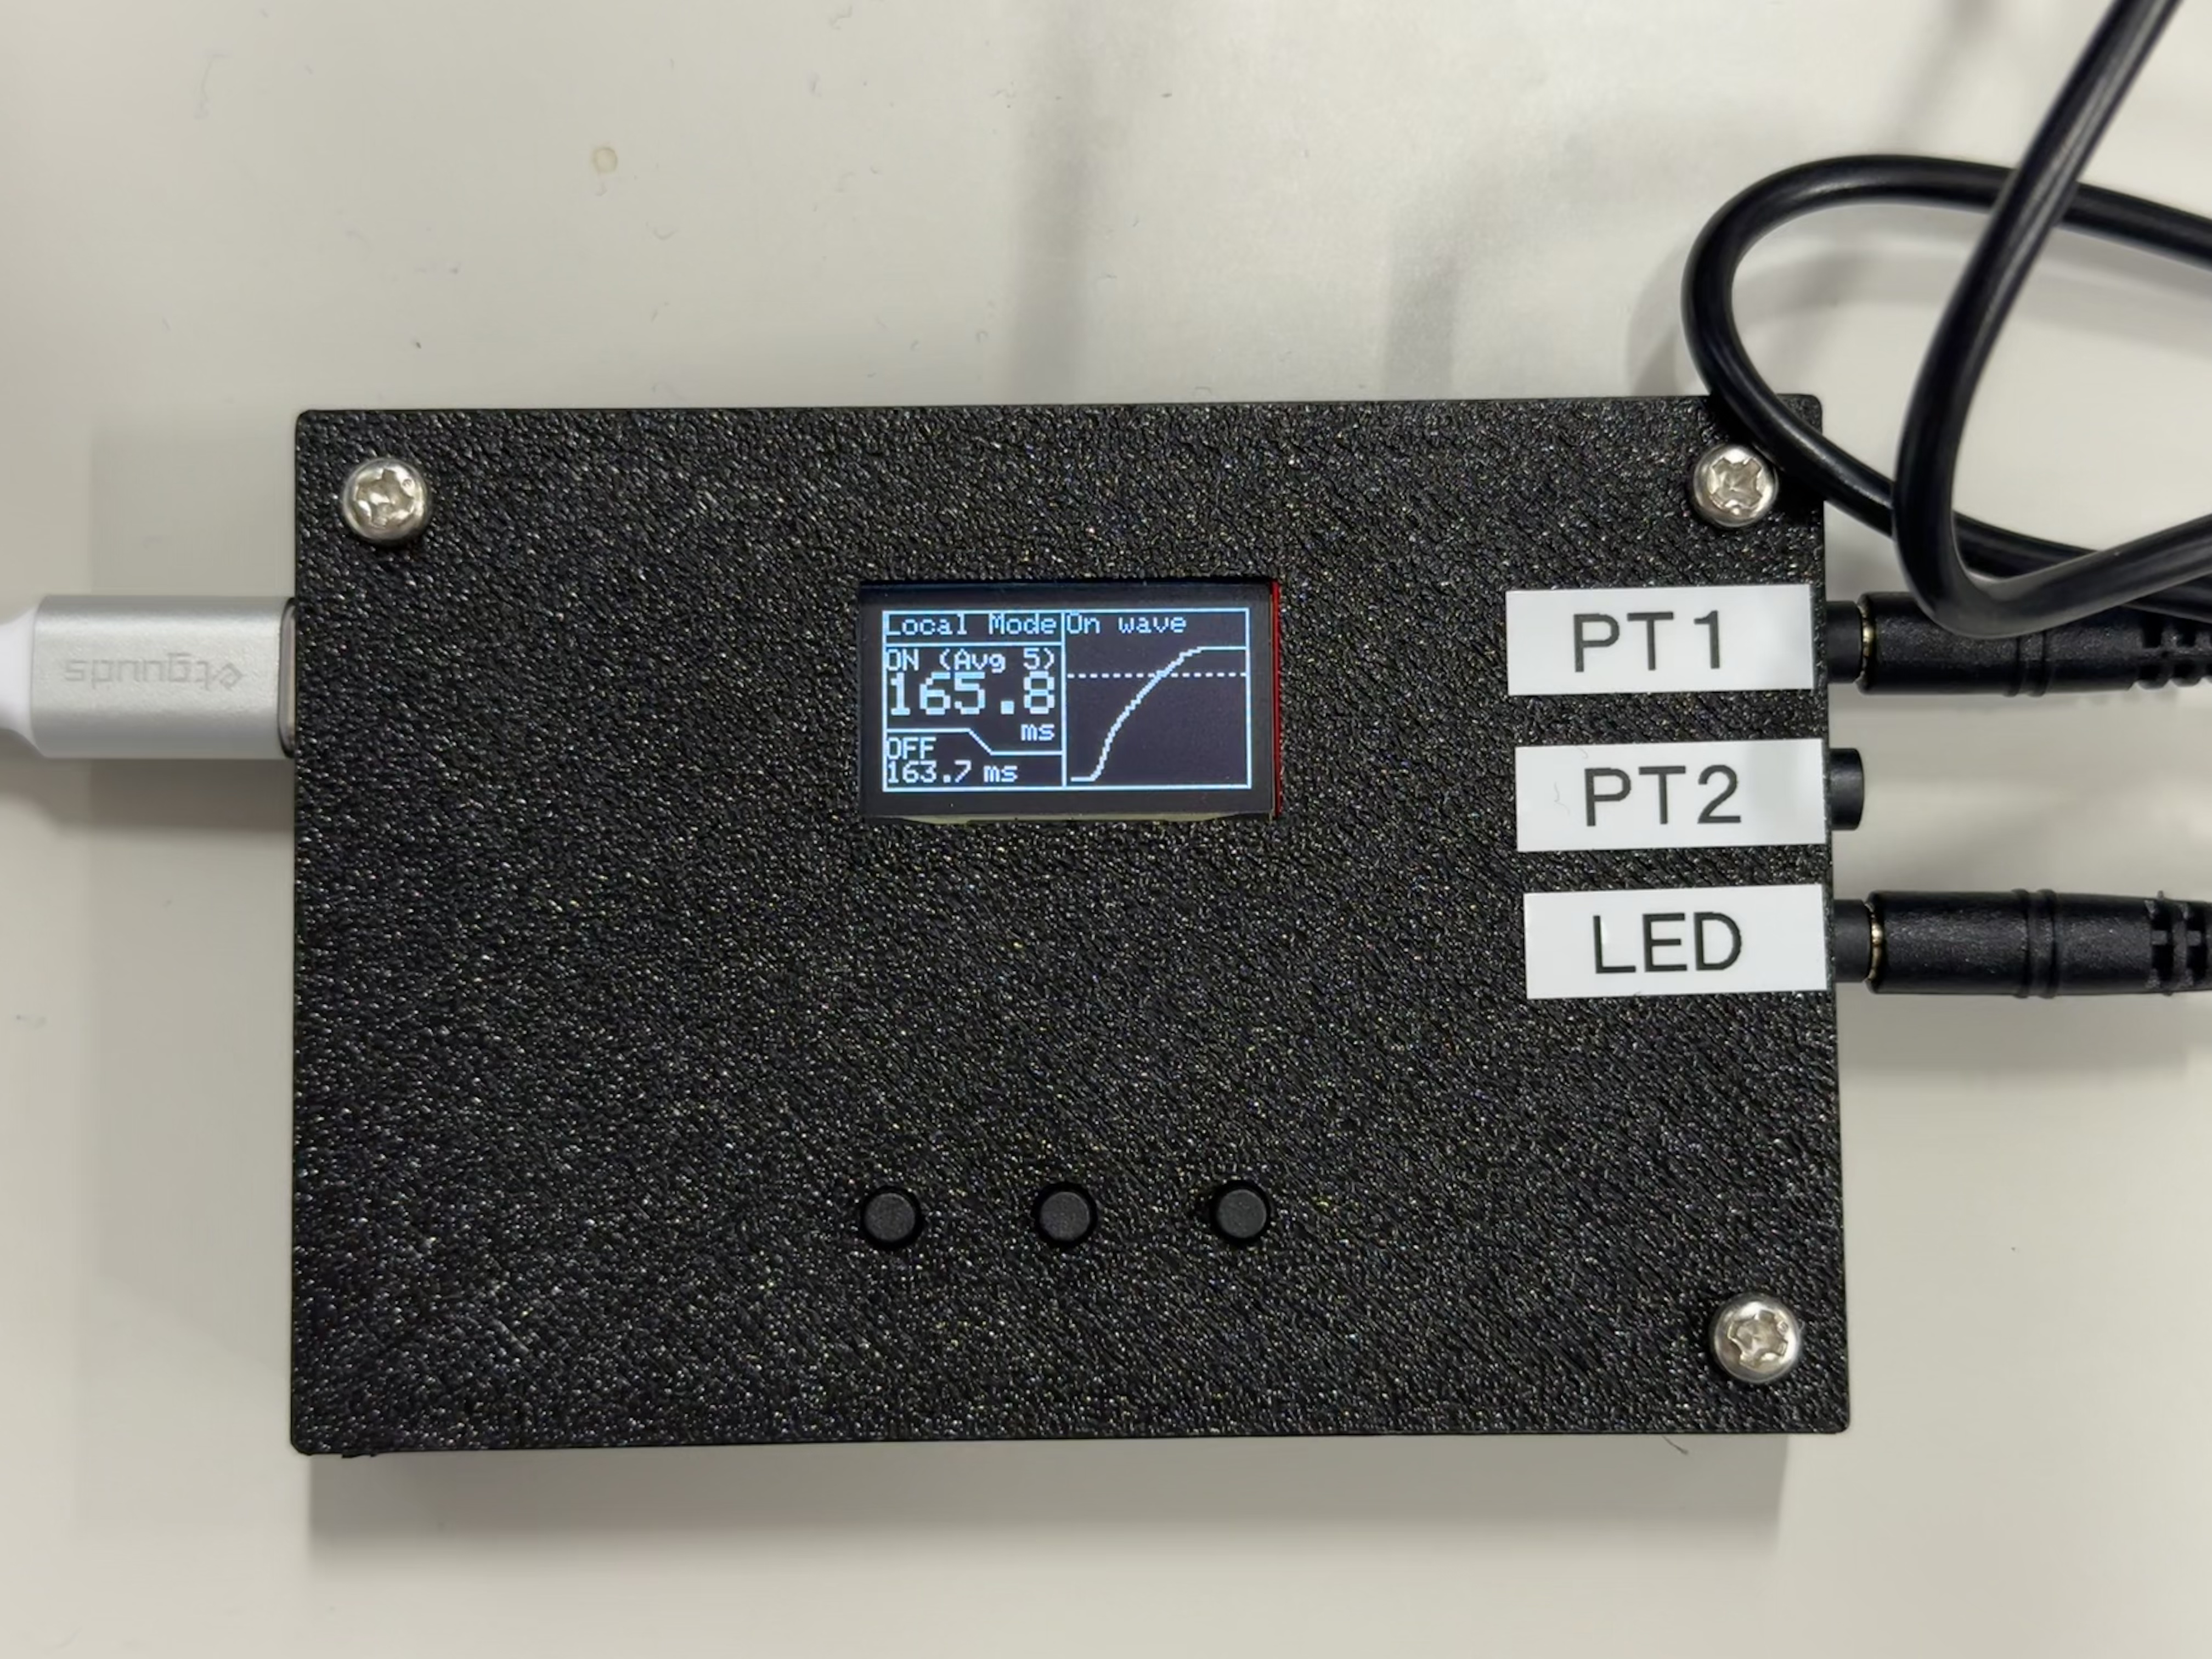
Screen 2: Shows the rising waveform. The left side shows the moving average of the last 5 measurements. Press the left button to move to the next screen.

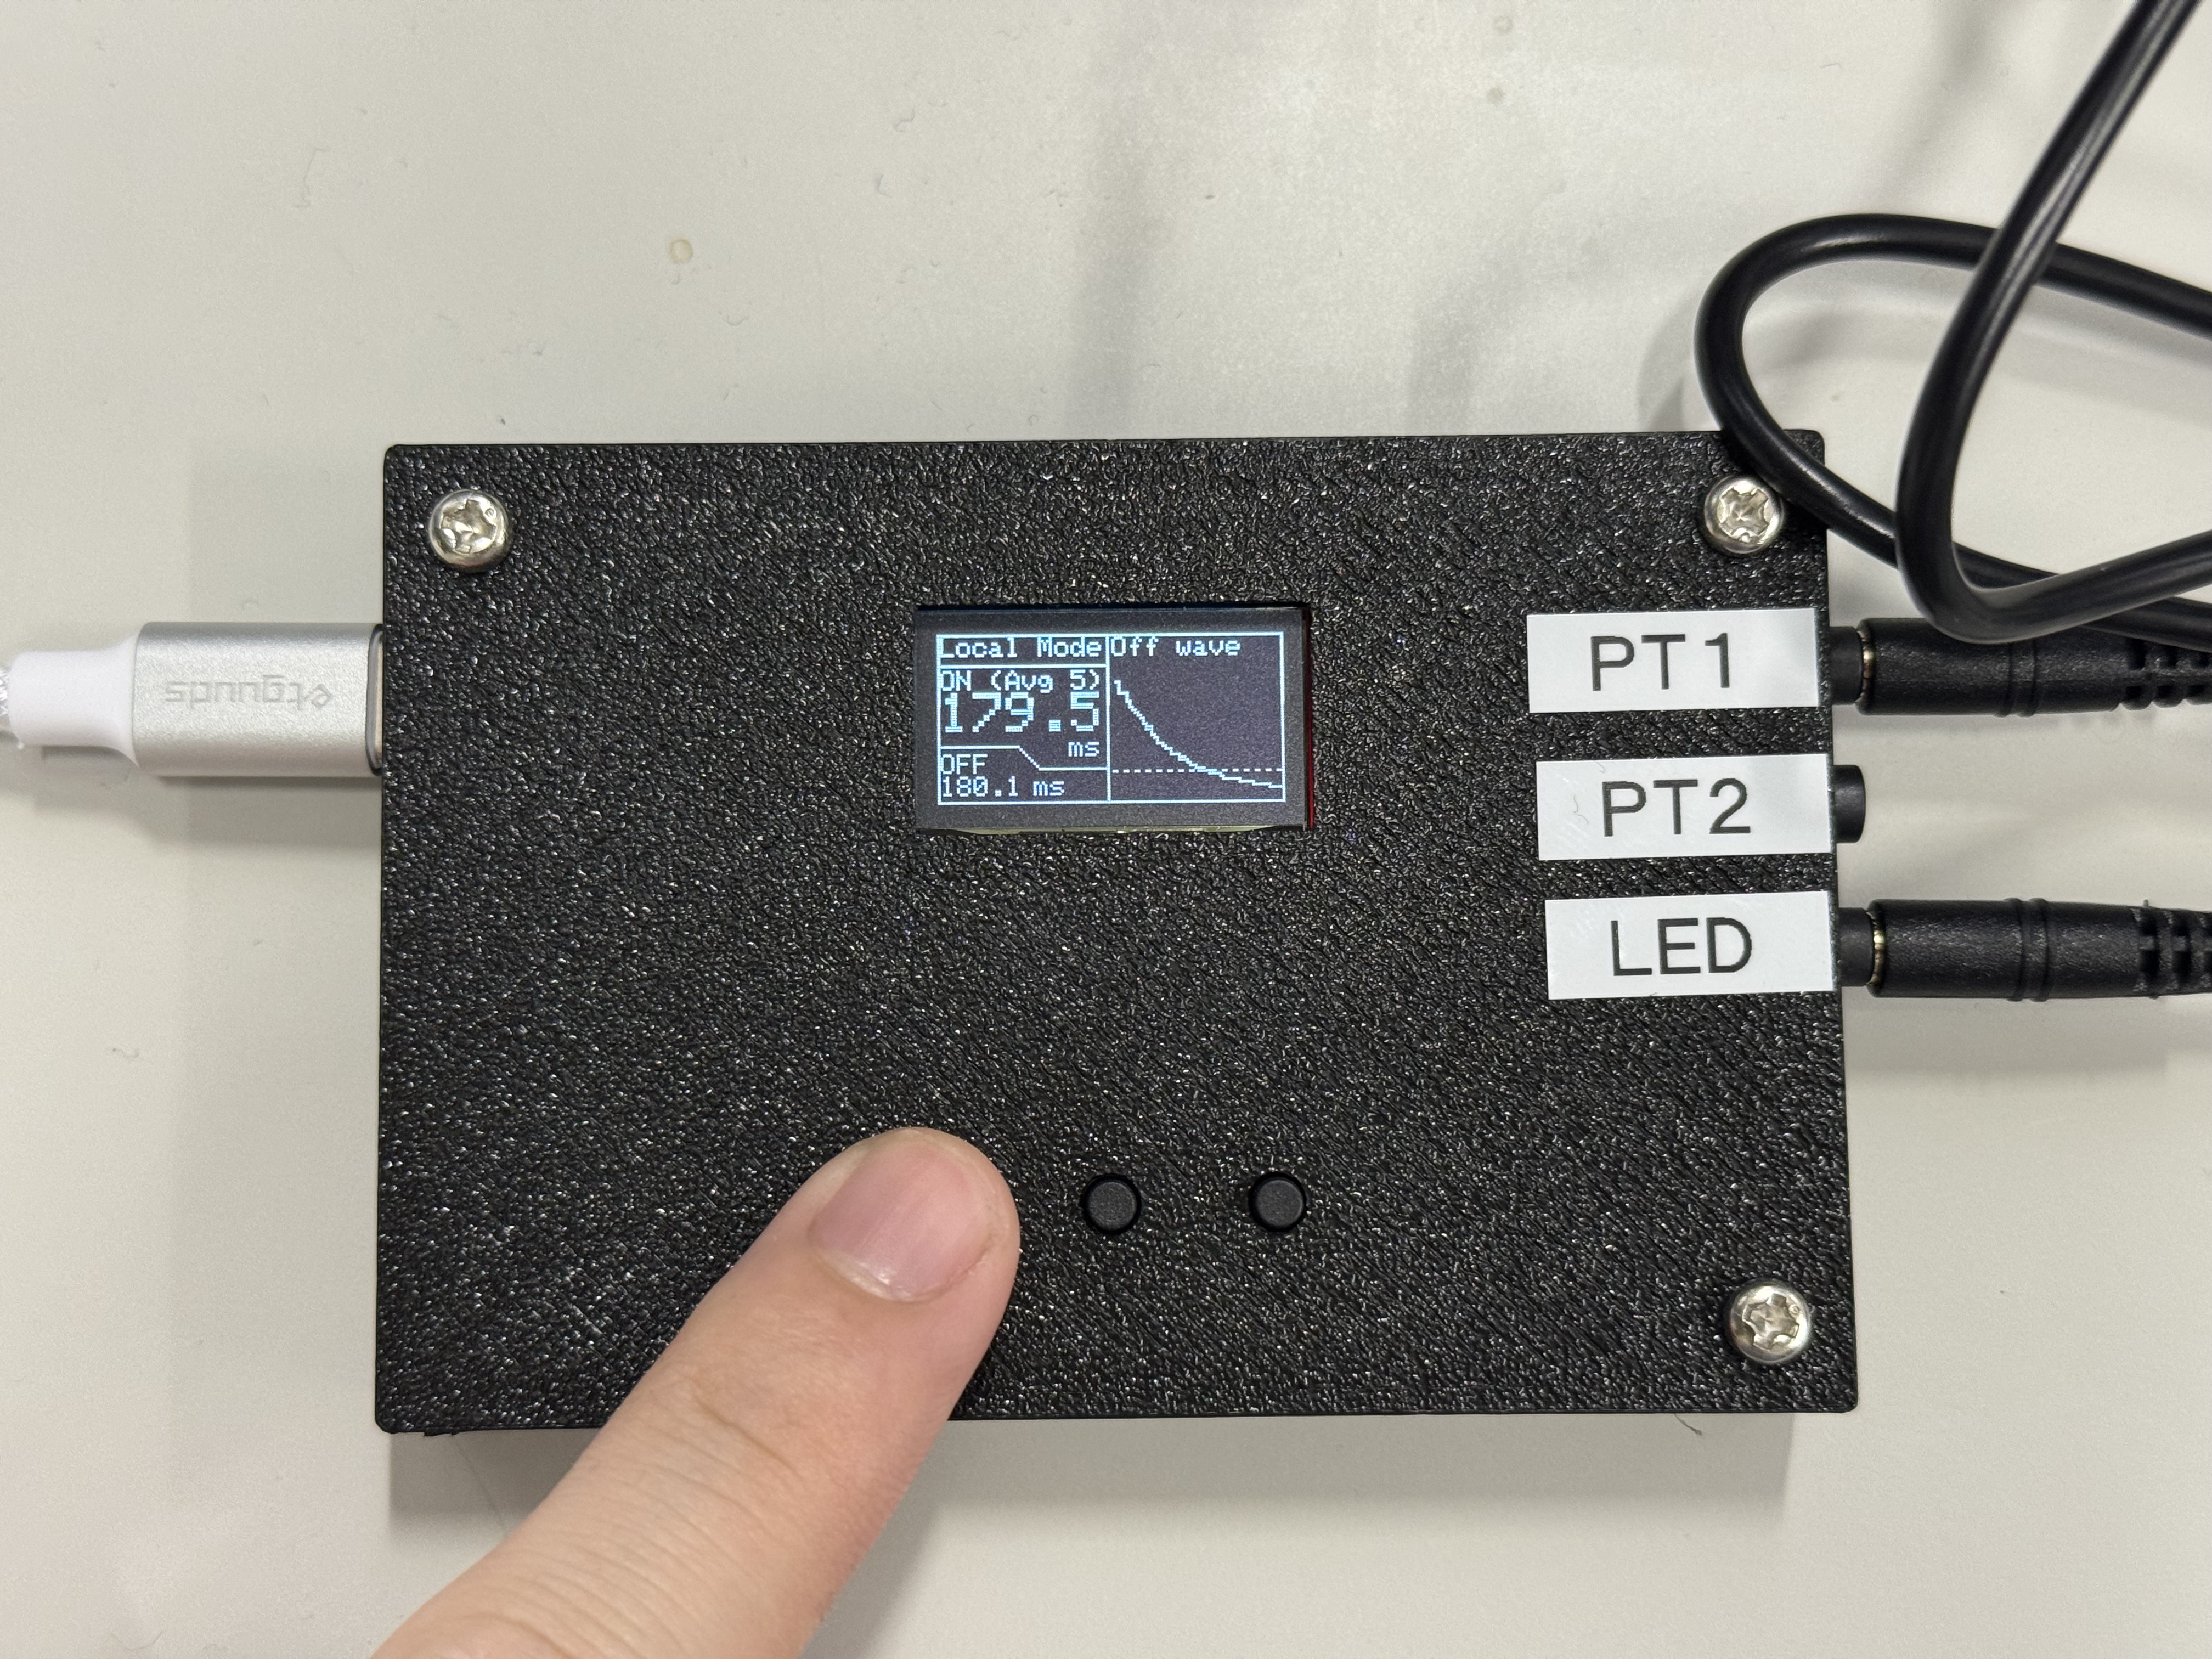
Screen 3: Shows the falling waveform. The left side shows the moving average of the last 5 measurements. Press the left button to return to screen 1.
Change the threshold
On screens 2 and 3, press button 2 and button 3 to change ON/OFF threshold values. By default, with 12-bit ADC resolution (4096), ON is judged at 80% (3276), and OFF at 20% (819). Each press changes the threshold by one step (200 counts).
Threshold values can also be checked in the Web GUI.
ShunChecker Application (Web GUI)
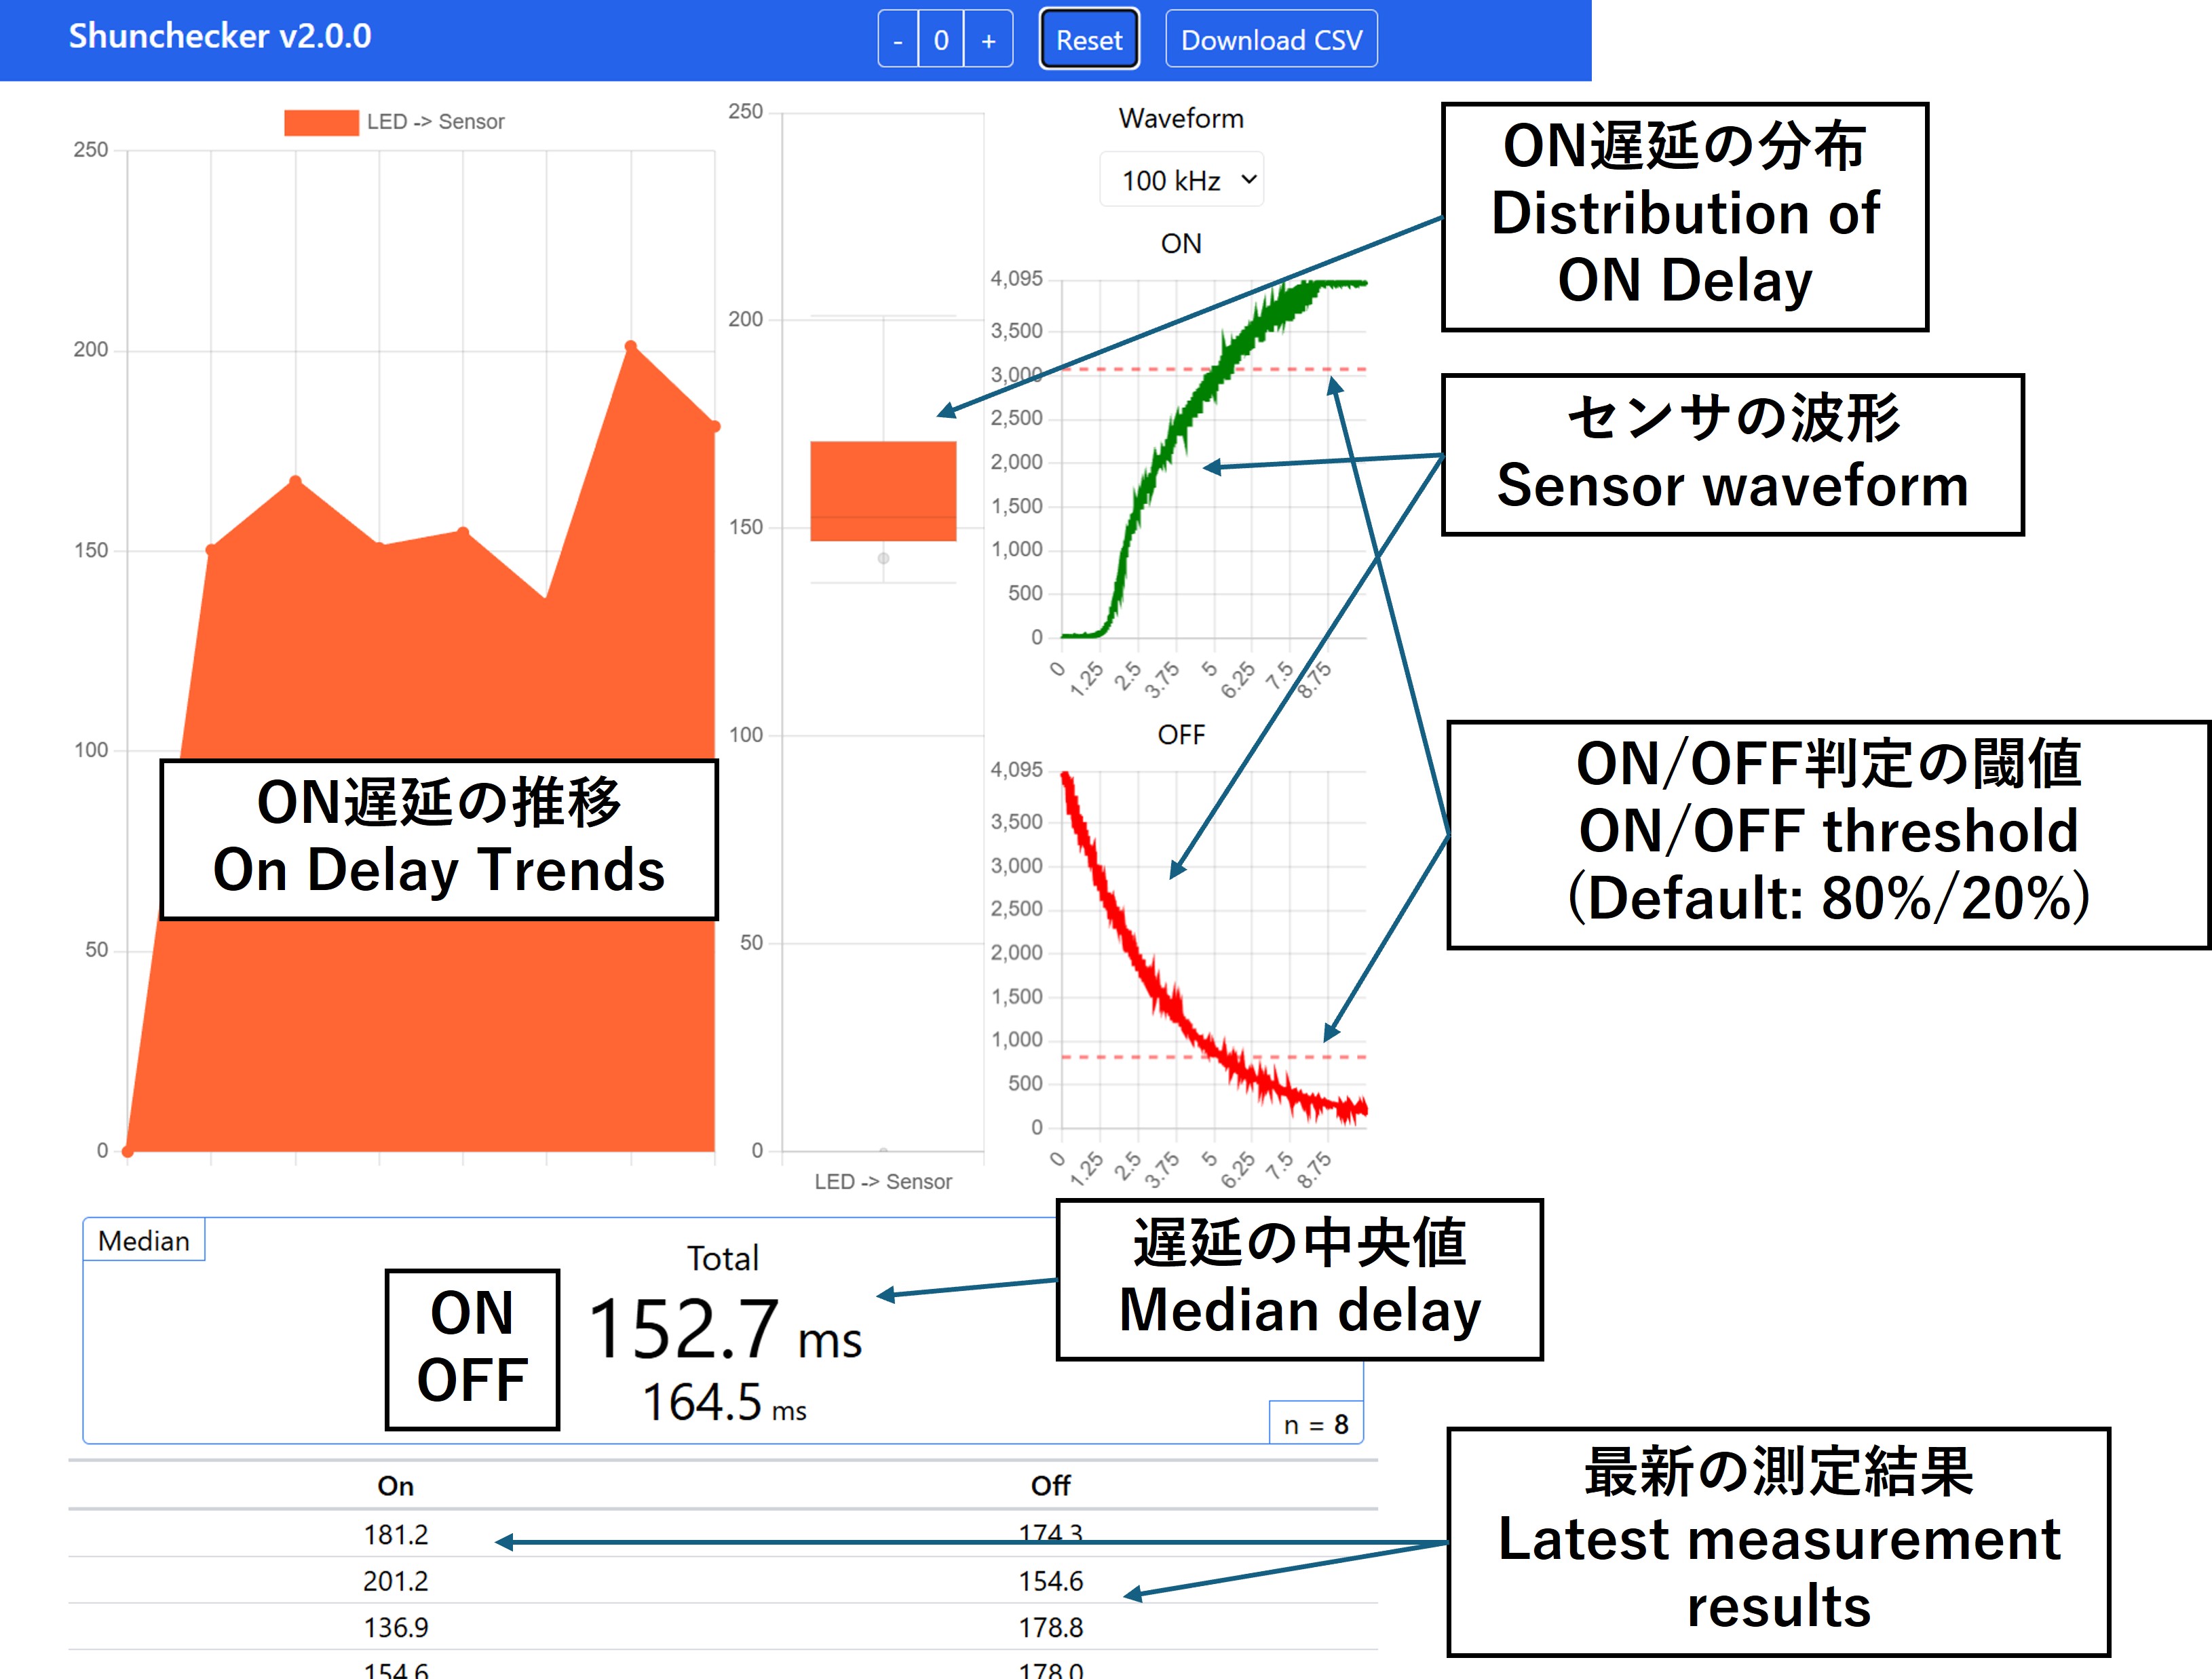
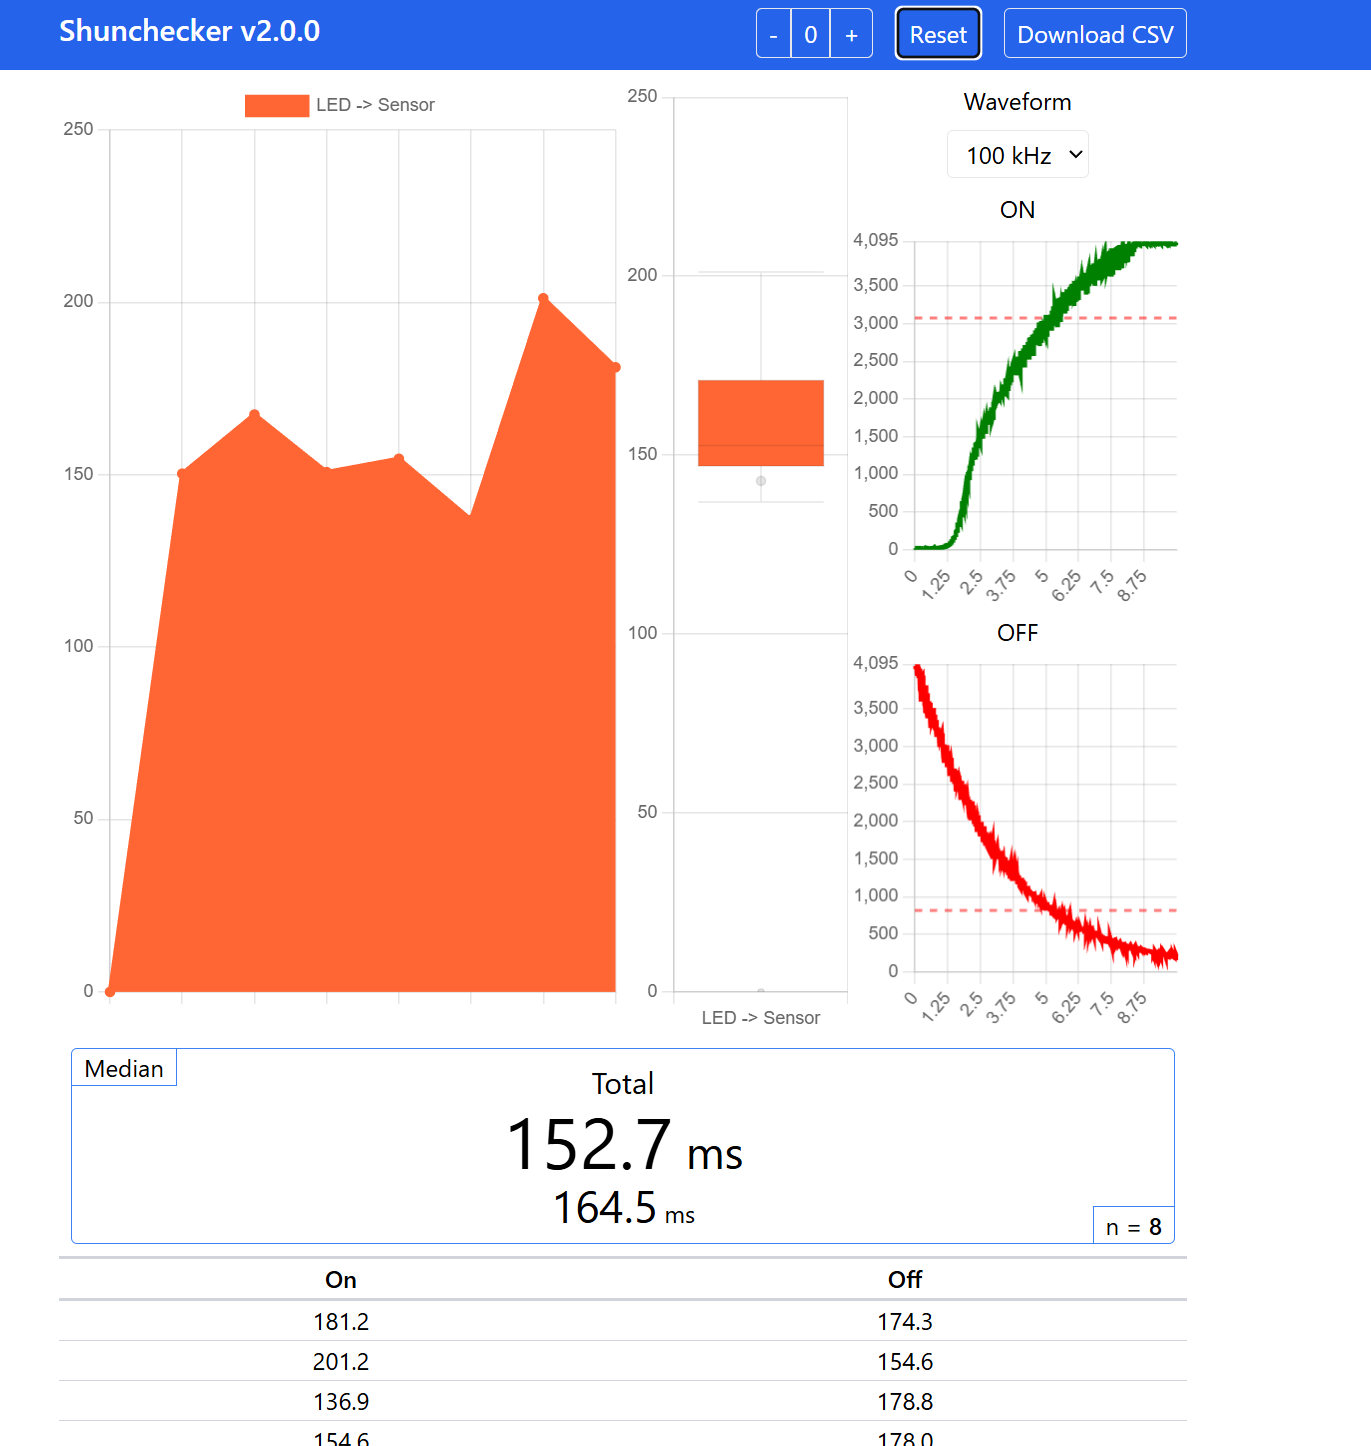
When measurement starts after connecting to a PC, results are displayed as follows.
- Pressing the Reset button clears all displayed statistics so far. Use this when restarting measurement.
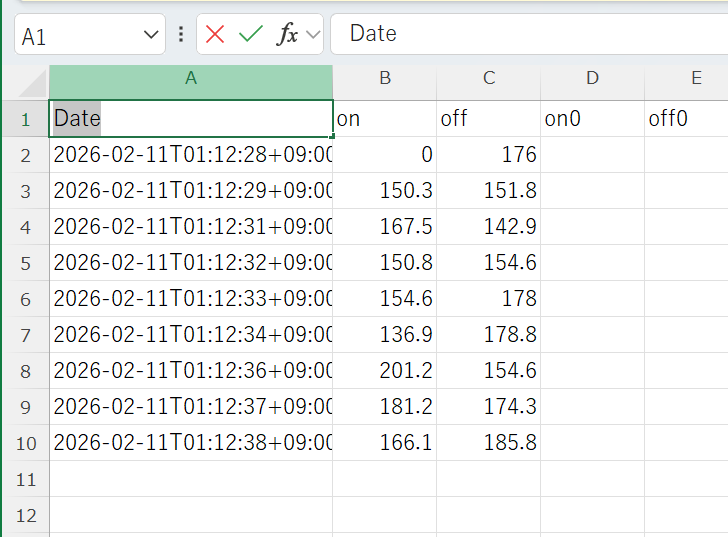
- Pressing Download CSV exports the measurement results in CSV format.
About Calibration
Sensor calibration is required for accurate latency measurement. Display characteristics greatly affect measured delay, and calibration can change values by around 10 ms. Calibration per display is recommended.
This is because sensor values vary with display brightness. On very bright displays, the sensor can saturate instantly and fail to provide correct latency.
💡 Sensor calibration is required for accurate latency measurement.
Calibration method
Rotate the variable resistor on the back of the sensor to adjust gain. While the display is lit (white), adjust near the point where the sensor value (vertical axis) is about to start decreasing. The maximum vertical-axis value is 4096 (12-bit).
Rear View
If gain is too high, values saturate. Rising-edge detection becomes faster, but falling-edge detection tends to take longer.
In the example image, the sensor quickly rises and saturates at around 4095 when lit. In this case, reduce gain so the peak is around 4095.
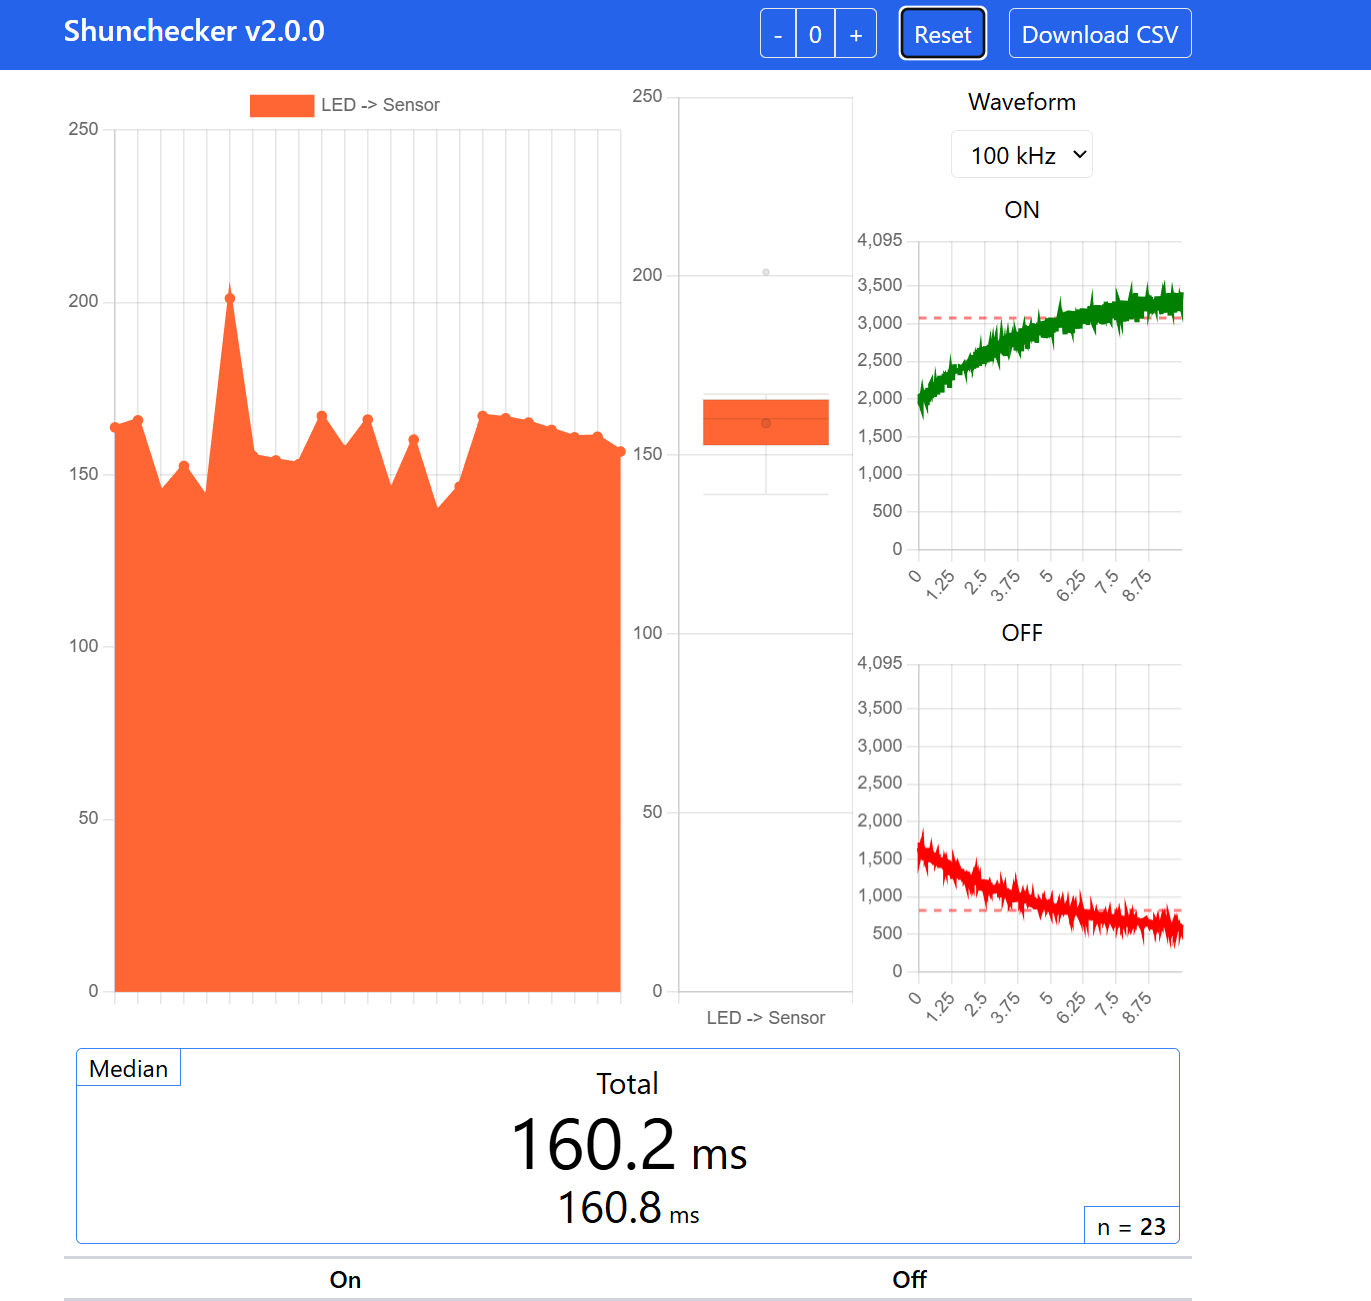
If gain is too low, rising-edge detection takes longer, causing longer rising time and shorter falling time.
In the example image, the value does not reach near 4096 and stays around the threshold region (around 3200). In this case, increase gain so the peak reaches around 4095.
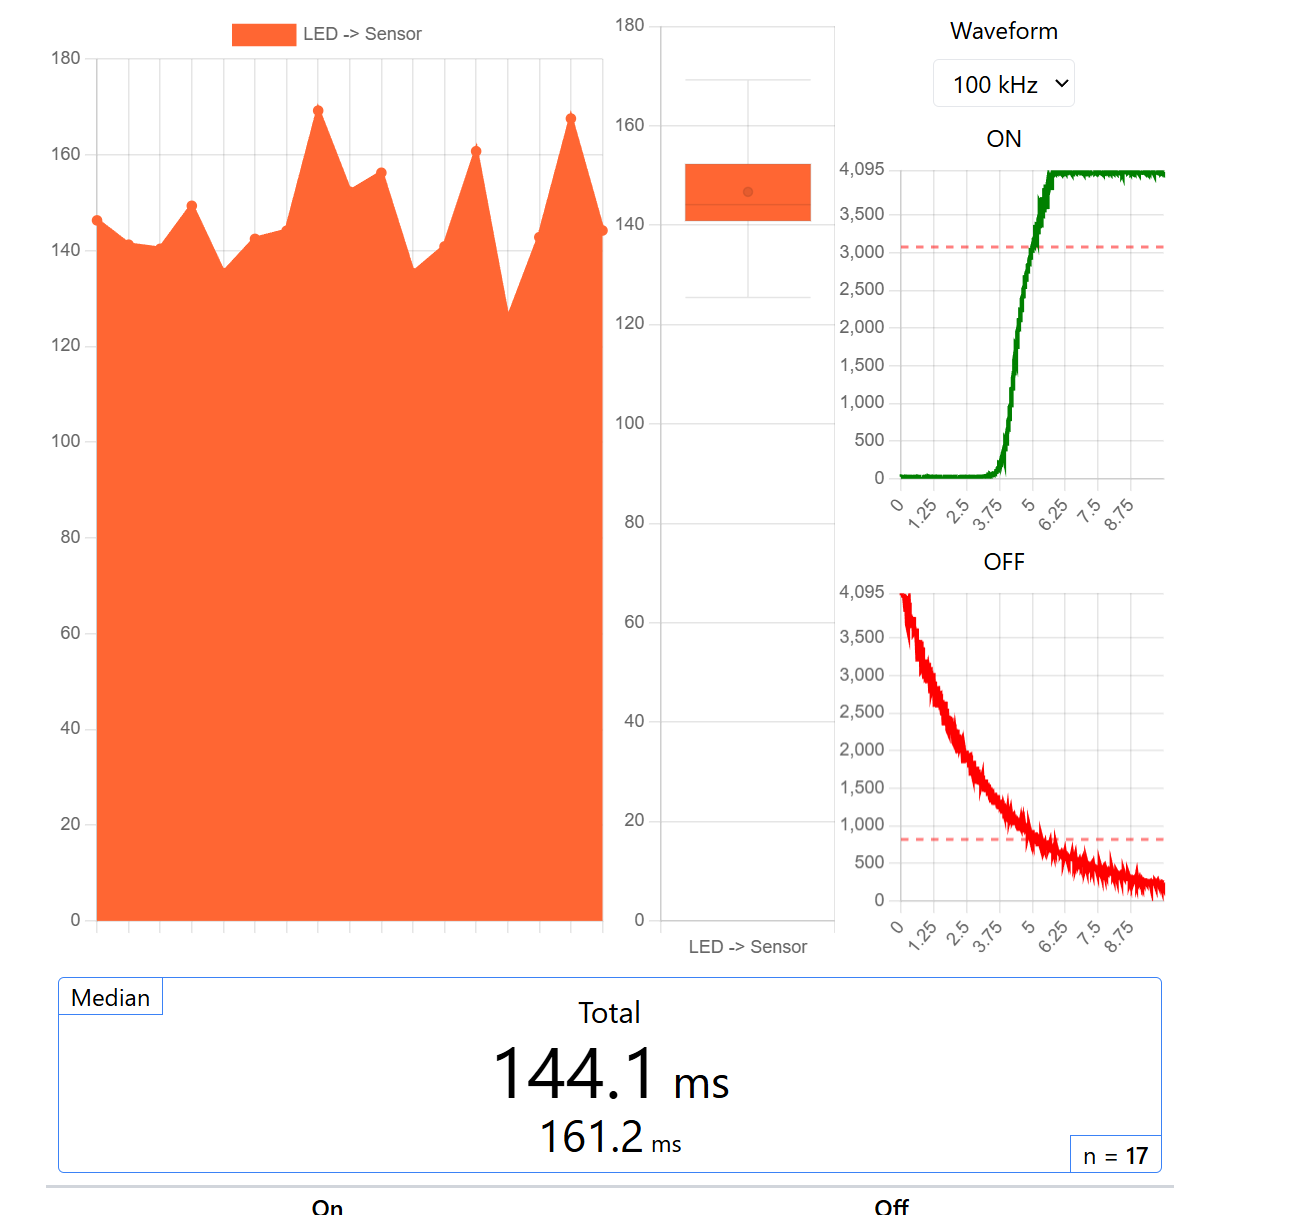
This is an example of correct adjustment. The sensor value does not clip at full scale and fits near the maximum around 4095. Full sensor scale is used properly and rising-edge delay is measured correctly.
Because display brightness changes across devices, calibration should be done for each display.
Specifications
| Item | |
|---|---|
| Time resolution | 2 μs |
| Voltage resolution | 12 bit (4096 steps) |
| Power | DC5V 500mA (Powered via USB Type-C) |
| Operating mode | Standalone operation Logging available via PC connection |
| Display | OLED 128 x 64 px |
| Size | 90 x 60 mm |
Support / Contact
Please contact us via the inquiry form. We also welcome custom requests and feature requests.